


1. Introduction
When a volatile liquid droplet is placed on a hot solid surface, superheated well above the boiling temperature, it neither touches the substrate nor boils, but rather floats on a thin film of its own vapour. This fascinating phenomenon, known as the Leidenfrost effect, has not ceased to attract attention since its first descriptions approximately 300 years ago (Boerhaave Reference Boerhaave1732; Leidenfrost Reference Leidenfrost1756). This is due to not only the myriad of intriguing and unexpected behaviours a droplet can exhibit in this state, but also its relevance across a wide range of industrial and technological processes, spanning from the traditional heat transfer applications to the emerging field of multiphase milli-/micro-fluidics. See, for example, the review articles of Quéré (Reference Quéré2013), Ajaev & Kabov (Reference Ajaev and Kabov2021) and Stewart (Reference Stewart2022), dedicated book chapters in Brutin (Reference Brutin2015) and Marengo & De Coninck (Reference Marengo and de Coninck2022) and the many references therein.
The vapour film, a key feature of the Leidenfrost state, ensures the droplet levitation while acting as a thermal insulator, resulting in relatively low evaporation rates and hence long lifetimes of the droplet. In this state, the droplet’s weight is balanced by the pressure within such a vapour cushion squeezed by the slowly and steadily evaporating droplet. With no contact with the substrate, the observable shapes of the droplets are governed by a balance between capillarity and gravity similarly to a perfectly non-wetting (superhydrophobic) situation. Denoting the capillary length by
 $\ell _c$
, droplets with radii
$\ell _c$
, droplets with radii
 $R$
smaller than
$R$
smaller than
 $\ell _c$
remain quasi-spherical while puddles larger than
$\ell _c$
remain quasi-spherical while puddles larger than
 $\ell _c$
are flattened by gravity, whose height is limited by
$\ell _c$
are flattened by gravity, whose height is limited by
 $\approx 2\ell _c$
(Biance et al. Reference Biance, Clanet and Quéré2003). The profile of the underlying vapour film is non-trivial. For a large droplet with
$\approx 2\ell _c$
(Biance et al. Reference Biance, Clanet and Quéré2003). The profile of the underlying vapour film is non-trivial. For a large droplet with
 $R\gtrsim \ell _c$
, the vapour film exhibits a pocket-like structure composed of an internal vapour ‘pocket’ surrounded by a thin neck. As the droplet gets smaller, the vapour film slims down, the droplet getting closer to the substrate. When the droplet radius is small enough as compared with
$R\gtrsim \ell _c$
, the vapour film exhibits a pocket-like structure composed of an internal vapour ‘pocket’ surrounded by a thin neck. As the droplet gets smaller, the vapour film slims down, the droplet getting closer to the substrate. When the droplet radius is small enough as compared with
 $\ell _c$
, the vapour pocket disappears completely, and the droplet becomes quasi-spherical, with a small circular area slightly flattened at the bottom. Accurate interferometric measurements of the vapour film thickness profile (Burton et al. Reference Burton, Sharpe, van der Veen, Franco and Nagel2012) turn out to be in a good agreement with a refined theoretical model (Sobac et al. Reference Sobac, Rednikov, Dorbolo and Colinet2014, Reference Sobac, Rednikov, Dorbolo and Colinet2021) coupling lubrication vapour flow, capillarity and hydrostatic pressure effects, which was recently confirmed numerically by Chakraborty et al. (Reference Chakraborty, Chubynsky and Sprittles2022). Note that the main scaling laws featuring the shapes of a Leidenfrost droplet and its evaporation dynamics can be found in Biance et al. (Reference Biance, Clanet and Quéré2003), Pomeau et al. (Reference Pomeau, Le Berre, Celestini and Frisch2012) and Sobac et al. (Reference Sobac, Rednikov, Dorbolo and Colinet2014, Reference Sobac, Rednikov, Dorbolo and Colinet2021).
$\ell _c$
, the vapour pocket disappears completely, and the droplet becomes quasi-spherical, with a small circular area slightly flattened at the bottom. Accurate interferometric measurements of the vapour film thickness profile (Burton et al. Reference Burton, Sharpe, van der Veen, Franco and Nagel2012) turn out to be in a good agreement with a refined theoretical model (Sobac et al. Reference Sobac, Rednikov, Dorbolo and Colinet2014, Reference Sobac, Rednikov, Dorbolo and Colinet2021) coupling lubrication vapour flow, capillarity and hydrostatic pressure effects, which was recently confirmed numerically by Chakraborty et al. (Reference Chakraborty, Chubynsky and Sprittles2022). Note that the main scaling laws featuring the shapes of a Leidenfrost droplet and its evaporation dynamics can be found in Biance et al. (Reference Biance, Clanet and Quéré2003), Pomeau et al. (Reference Pomeau, Le Berre, Celestini and Frisch2012) and Sobac et al. (Reference Sobac, Rednikov, Dorbolo and Colinet2014, Reference Sobac, Rednikov, Dorbolo and Colinet2021).
In practice, this absence of contact between the Leidenfrost droplet and the substrate leads to very rich dynamics. For large puddle-like droplets, the vapour pocket grows until it eventually pops up as a central ‘chimney’ due to a Rayleigh–Taylor mechanism (Biance et al. Reference Biance, Clanet and Quéré2003; Snoeijer et al. Reference Snoeijer, Brunet and Eggers2009). Instability of large droplets can also occur (either spontaneously or forced) in the form of ‘star-faceted’ shapes when azimuthal surface oscillations develop along the periphery of the droplets (Brunet & Snoeijer Reference Brunet and Snoeijer2011; Ma et al. Reference Ma, Liétor-Santos and Burton2017; Ma & Burton Reference Ma and Burton2018; Bergen et al. Reference Bergen, Basso and Bostwick2019; Bouillant et al. Reference Bouillant, Cohen, Clanet and Quéré2021a
). Self-induced spontaneous oscillations can also occur in the vertical plane, yielding the recently reported bobing, bouncing or trampolining dynamics when Leidenfrost droplets reach moderate and small sizes with
 $R\leqslant \ell _c$
(Liu & Tran Reference Liu and Tran2020; Graeber et al. Reference Graeber, Regulagadda, Hodel, Küttel, Landolf, Schutzius and Poulikakos2021). Other spectacular behaviours related to their high mobility have been observed. These include Leidenfrost wheels, when a droplet initially at rest spontaneously rolls and moves over a flat surface like a wheel due to symmetry breaking in the internal flow of the liquid (Bouillant et al. Reference Bouillant, Mouterde, Bourrianne, Lagarde, Clanet and Quéré2018), and self-propelling of Leidenfrost droplets when interacting with substrates breaking the axisymmetry, either due to surface topography such as ratchets or herringbones (Linke et al. Reference Linke, Alemán, Melling, Taormina, Francis, Dow-Hygelund, Narayanan, Taylor and Stout2006; Dupeux et al. Reference Dupeux, Le Merrer, Clanet and Quéré2011; Marín et al. Reference Marín, Arnaldo del Cerro, Römer, Pathiraj, Huis in ‘t Veld and Lohse2012; Baier et al. Reference Baier, Dupeux, Herbert, Hardt and Quéré2013; Soto et al. Reference Soto, Lagubeau, Clanet and Quéré2016; Dodd et al. Reference Dodd, Agrawal, Parnell, Geraldi, Xu, Wells, Stuart-Cole, Newton, McHale and Wood2019), or temperature gradients (Sobac et al. 2017; Dodd et al. Reference Dodd, Agrawal, Geraldi, Xu, Wells, Martin, Newton, McHale and Wood2020; Bouillant et al. Reference Bouillant, Lafoux, Clanet and Quéré2021b
). Thus, droplets move in a direction dictated by the patterns due to symmetry breaking of the vapour layer. Strategies have emerged to control the motion and manipulate these droplets. In addition to geometric and thermal heterogeneities, chemical patterns of the surface can also be exploited to tailor the vapour film, enabling the stretching, sloshing, spinning, propelling or trapping of a Leidenfrost droplet (Li et al. Reference Li, Li, Lyu, Zhao, Xue, Li, Li, Li, Sun and Song2023).
$R\leqslant \ell _c$
(Liu & Tran Reference Liu and Tran2020; Graeber et al. Reference Graeber, Regulagadda, Hodel, Küttel, Landolf, Schutzius and Poulikakos2021). Other spectacular behaviours related to their high mobility have been observed. These include Leidenfrost wheels, when a droplet initially at rest spontaneously rolls and moves over a flat surface like a wheel due to symmetry breaking in the internal flow of the liquid (Bouillant et al. Reference Bouillant, Mouterde, Bourrianne, Lagarde, Clanet and Quéré2018), and self-propelling of Leidenfrost droplets when interacting with substrates breaking the axisymmetry, either due to surface topography such as ratchets or herringbones (Linke et al. Reference Linke, Alemán, Melling, Taormina, Francis, Dow-Hygelund, Narayanan, Taylor and Stout2006; Dupeux et al. Reference Dupeux, Le Merrer, Clanet and Quéré2011; Marín et al. Reference Marín, Arnaldo del Cerro, Römer, Pathiraj, Huis in ‘t Veld and Lohse2012; Baier et al. Reference Baier, Dupeux, Herbert, Hardt and Quéré2013; Soto et al. Reference Soto, Lagubeau, Clanet and Quéré2016; Dodd et al. Reference Dodd, Agrawal, Parnell, Geraldi, Xu, Wells, Stuart-Cole, Newton, McHale and Wood2019), or temperature gradients (Sobac et al. 2017; Dodd et al. Reference Dodd, Agrawal, Geraldi, Xu, Wells, Martin, Newton, McHale and Wood2020; Bouillant et al. Reference Bouillant, Lafoux, Clanet and Quéré2021b
). Thus, droplets move in a direction dictated by the patterns due to symmetry breaking of the vapour layer. Strategies have emerged to control the motion and manipulate these droplets. In addition to geometric and thermal heterogeneities, chemical patterns of the surface can also be exploited to tailor the vapour film, enabling the stretching, sloshing, spinning, propelling or trapping of a Leidenfrost droplet (Li et al. Reference Li, Li, Lyu, Zhao, Xue, Li, Li, Li, Sun and Song2023).
As compared with large and moderate size droplets, the dynamics of small, near-spherical Leidenfrost droplets (
 $R\ll \ell _c$
) has not received so much attention. In their seminal work, Celestini et al. (Reference Celestini, Frisch and Pomeau2012) first explored the final fate of Leidenfrost droplets as they became very small, just moments before disappearing. By spraying tiny droplets of water or ethanol in the size range of approximately
$R\ll \ell _c$
) has not received so much attention. In their seminal work, Celestini et al. (Reference Celestini, Frisch and Pomeau2012) first explored the final fate of Leidenfrost droplets as they became very small, just moments before disappearing. By spraying tiny droplets of water or ethanol in the size range of approximately
 $1-30\,\unicode{x03BC} \mathrm {m}$
onto a superheated substrate, they discovered that when small enough (i.e. with
$1-30\,\unicode{x03BC} \mathrm {m}$
onto a superheated substrate, they discovered that when small enough (i.e. with
 $R$
below a characteristic radius corresponding to the breakup of the lubrication approximation), Leidenfrost droplets took off from the heated substrate with an elevation
$R$
below a characteristic radius corresponding to the breakup of the lubrication approximation), Leidenfrost droplets took off from the heated substrate with an elevation
 $h\propto R^{-1/2}$
, as predicted also by Pomeau et al. (Reference Pomeau, Le Berre, Celestini and Frisch2012). Remarkably, in this regime, droplets become too light to withstand the upward force generated due to evaporation, and they reach higher and higher elevations while vapourising. This behaviour drastically contrasts with what is observed for larger Leidenfrost droplets. More recently, Lyu et al. (Reference Lyu, Mathai, Wang, Sobac, Colinet, Lohse and Sun2019) observed that a second final fate, other than lift-off, is possible for Leidenfrost droplets. Namely, if the liquid droplet is not pure or contaminant-free enough, small Leidenfrost droplets are unable to take off, but instead disappear by exploding with an audible crack.
$h\propto R^{-1/2}$
, as predicted also by Pomeau et al. (Reference Pomeau, Le Berre, Celestini and Frisch2012). Remarkably, in this regime, droplets become too light to withstand the upward force generated due to evaporation, and they reach higher and higher elevations while vapourising. This behaviour drastically contrasts with what is observed for larger Leidenfrost droplets. More recently, Lyu et al. (Reference Lyu, Mathai, Wang, Sobac, Colinet, Lohse and Sun2019) observed that a second final fate, other than lift-off, is possible for Leidenfrost droplets. Namely, if the liquid droplet is not pure or contaminant-free enough, small Leidenfrost droplets are unable to take off, but instead disappear by exploding with an audible crack.
Here, we propose to theoretically revisit the dynamics of small spherical Leidenfrost droplets with the aim of comprehensively and thoroughly analysing the mechanisms involved in their final fate. Thanks to a model including a realistic description of the coupling between hydrodynamics, heat transfer and evaporation, this work seems to be the first to provide exact estimates of the droplet elevation as a function of the physical parameters and without any fitting parameter. After numerically computing the entirety of fluxes, evaporation rates and forces, a master curve for droplet elevation as a function of its size is derived by simply balancing the droplet weight with the upward evaporation-induced hydrodynamic force. While the scaling law agrees with Celestini et al. (Reference Celestini, Frisch and Pomeau2012) and Pomeau et al. (Reference Pomeau, Le Berre, Celestini and Frisch2012), there appear subtleties concerning the prefactor. Moreover, the analysis reveals that such a classical quasi-steady description is not fully sufficient to describe the take-off phenomenon. Even at these small scales, further dynamical effects must be taken into account to achieve a good agreement with the original experimental data of Celestini et al. (Reference Celestini, Frisch and Pomeau2012).
2. Statement of the problem, premises and outlook

Figure 1. Sketch of the problem.
Consider a small evaporating spherical droplet of radius
 $R$
in a Leidenfrost state levitating at a height
$R$
in a Leidenfrost state levitating at a height
 $h$
above a superheated substrate at a ‘wall’ temperature
$h$
above a superheated substrate at a ‘wall’ temperature
 $T_w$
, as sketched in figure 1. The substrate is flat and horizontal. We shall be interested in the take-off of Leidenfrost droplets (Celestini et al. Reference Celestini, Frisch and Pomeau2012; Pomeau et al. Reference Pomeau, Le Berre, Celestini and Frisch2012), which occurs in the realm of small droplets (
$T_w$
, as sketched in figure 1. The substrate is flat and horizontal. We shall be interested in the take-off of Leidenfrost droplets (Celestini et al. Reference Celestini, Frisch and Pomeau2012; Pomeau et al. Reference Pomeau, Le Berre, Celestini and Frisch2012), which occurs in the realm of small droplets (
 $R$
of the order of tens of
$R$
of the order of tens of
 $\unicode{x03BC}$
m) with a negligible deviation from the spherical shape. The (immediate) surroundings of the droplet are assumed to be saturated with vapour (totally displacing the air) and heated through to the substrate temperature. Thus,
$\unicode{x03BC}$
m) with a negligible deviation from the spherical shape. The (immediate) surroundings of the droplet are assumed to be saturated with vapour (totally displacing the air) and heated through to the substrate temperature. Thus,
 $T_w$
is here also an effective overall ambient temperature (i.e.
$T_w$
is here also an effective overall ambient temperature (i.e.
 $T_{{amb}}=T_w$
). The droplet is assumed isothermal at saturation (boiling) temperature
$T_{{amb}}=T_w$
). The droplet is assumed isothermal at saturation (boiling) temperature
 $T_{{sat}}$
. The superheat is given by
$T_{{sat}}$
. The superheat is given by
 $\Delta T=T_w-T_{{sat}}\gt 0$
. The typical values considered here are
$\Delta T=T_w-T_{{sat}}\gt 0$
. The typical values considered here are
 $T_{{sat}}=100\;^\circ \text {C}$
(water at atmospheric pressure),
$T_{{sat}}=100\;^\circ \text {C}$
(water at atmospheric pressure),
 $T_w=400\;^\circ \text {C}$
and
$T_w=400\;^\circ \text {C}$
and
 $\Delta T=300\;^\circ \text {C}$
. Such superheat occurs e.g. in the experiments by Celestini et al. (Reference Celestini, Frisch and Pomeau2012).
$\Delta T=300\;^\circ \text {C}$
. Such superheat occurs e.g. in the experiments by Celestini et al. (Reference Celestini, Frisch and Pomeau2012).
Mathematically, the goal of the present consideration is obtaining an interrelation between
 $h$
,
$h$
,
 $R$
(in particular, as functions of time
$R$
(in particular, as functions of time
 $t$
due to the droplet evaporation) and the parameters of the problem, such as
$t$
due to the droplet evaporation) and the parameters of the problem, such as
 $\Delta T$
,
$\Delta T$
,
 $g$
(gravitational acceleration,
$g$
(gravitational acceleration,
 $9.81\,\mathrm {m\, s^-{^2}}$
) and the liquid and vapour properties. The latter include
$9.81\,\mathrm {m\, s^-{^2}}$
) and the liquid and vapour properties. The latter include
 $\rho _l$
(liquid density, defined at
$\rho _l$
(liquid density, defined at
 $T_{{sat}}$
) as well as the following vapour properties:
$T_{{sat}}$
) as well as the following vapour properties:
 $\rho _v$
(density),
$\rho _v$
(density),
 $\mu _v$
(dynamic viscosity),
$\mu _v$
(dynamic viscosity),
 $\nu _v=\mu _v/\rho _v$
(kinematic viscosity),
$\nu _v=\mu _v/\rho _v$
(kinematic viscosity),
 $\lambda _v$
(thermal conductivity),
$\lambda _v$
(thermal conductivity),
 $c_{p,v}$
(heat capacity at constant pressure),
$c_{p,v}$
(heat capacity at constant pressure),
 $\alpha _v=\lambda _v/(\rho _v c_{p,v})$
(thermal diffusivity) and
$\alpha _v=\lambda _v/(\rho _v c_{p,v})$
(thermal diffusivity) and
 $\mathcal {L}$
(latent heat of evaporation). These may vary considerably in the temperature range between
$\mathcal {L}$
(latent heat of evaporation). These may vary considerably in the temperature range between
 $T_{{sat}}$
and
$T_{{sat}}$
and
 $T_w$
. However, for the sake of simplicity, we shall here assume them constant and defined at the mid-temperature
$T_w$
. However, for the sake of simplicity, we shall here assume them constant and defined at the mid-temperature
 $ ({1}/{2})(T_w+T_{{sat}})$
, except for
$ ({1}/{2})(T_w+T_{{sat}})$
, except for
 $ \rho _l$
and
$ \rho _l$
and
 $\mathcal {L}$
defined at
$\mathcal {L}$
defined at
 $T_{{sat}}$
, similarly to the approach used elsewhere (Sobac et al. Reference Sobac, Rednikov, Dorbolo and Colinet2014, Reference Sobac, Talbot, Haut, Rednikov and Colinet2015). The relevant property values are provided in Appendix A.
$T_{{sat}}$
, similarly to the approach used elsewhere (Sobac et al. Reference Sobac, Rednikov, Dorbolo and Colinet2014, Reference Sobac, Talbot, Haut, Rednikov and Colinet2015). The relevant property values are provided in Appendix A.
Other key assumptions include negligible advective/convective effects (small Péclet and Reynolds numbers), so that the temperature field in the vapour is governed by heat conduction, while the evaporative flow from the droplet can be considered by means of the Stokes approximation. Quasi-steadiness of the temperature and velocity fields, in spite of
 $R$
and
$R$
and
 $h$
changing in time due to evaporation, is another key assumption of the analysis. In other words, these fields and the evaporation fluxes and forces they determine, are merely functions of the instantaneous values of
$h$
changing in time due to evaporation, is another key assumption of the analysis. In other words, these fields and the evaporation fluxes and forces they determine, are merely functions of the instantaneous values of
 $R$
and
$R$
and
 $h$
and do not depend on the history. It is under this premise that a preliminary calculation of these quantities is carried out in § 3. The validity of this and other assumptions is verified a posteriori in their due course.
$h$
and do not depend on the history. It is under this premise that a preliminary calculation of these quantities is carried out in § 3. The validity of this and other assumptions is verified a posteriori in their due course.
The quasi-steadiness assumption is also applied at first when it comes to the force balance on the droplet in § 4, permitting to predict the levitation height
 $h$
and make a first comparison with experiment. Yet, certain limitations are thereby disclosed, inspiring consideration of a more general droplet dynamics in §§ 5–7. However, even in such a situation, the quasi-steadiness of the quantities such as those calculated in § 3 is still assumed to hold.
$h$
and make a first comparison with experiment. Yet, certain limitations are thereby disclosed, inspiring consideration of a more general droplet dynamics in §§ 5–7. However, even in such a situation, the quasi-steadiness of the quantities such as those calculated in § 3 is still assumed to hold.
An important geometric parameter of the configuration (figure 1), meriting a special notation, is the ratio of the droplet’s height and radius
 \begin{equation} \delta =\frac {h}{R}. \end{equation}
In the present study, we shall be interested in a full range of this relative-height parameter, from very small to very large. The large values are expected for small droplets (small
 $R$
) upon a take-off (Celestini et al. Reference Celestini, Frisch and Pomeau2012; Pomeau et al. Reference Pomeau, Le Berre, Celestini and Frisch2012; Sobac et al. 2021; Chakraborty et al. Reference Chakraborty, Chubynsky and Sprittles2022). In contrast, small
$R$
) upon a take-off (Celestini et al. Reference Celestini, Frisch and Pomeau2012; Pomeau et al. Reference Pomeau, Le Berre, Celestini and Frisch2012; Sobac et al. 2021; Chakraborty et al. Reference Chakraborty, Chubynsky and Sprittles2022). In contrast, small
 $\delta$
are attained for larger droplets. In this way, we arrive at a transition from spherical Leidenfrost droplets to Leidenfrost droplets for which deformation (at first at the bottom slightly flattened by gravity) becomes essential. Such a transition is touched upon in § 8.
$\delta$
are attained for larger droplets. In this way, we arrive at a transition from spherical Leidenfrost droplets to Leidenfrost droplets for which deformation (at first at the bottom slightly flattened by gravity) becomes essential. Such a transition is touched upon in § 8.
3. Basic calculations: fields, fluxes and forces
Dimensionless variables are introduced using the scales given in table 1 (definitions to be given in their due course). For simplicity and expecting no confusion, no notation distinction is made between the original, dimensional variables and their dimensionless versions in the present section (the distinction being clear from the context). We just note that a dimensionless temperature is introduced as
 \begin{equation} \bar {T}=\frac {T-T_{{sat}}}{\Delta T}, \end{equation}
where recall that
 $\Delta T=T_w-T_{{sat}}$
. Hereafter, in the same spirit, the bars are omitted for the sake of brevity.
$\Delta T=T_w-T_{{sat}}$
. Hereafter, in the same spirit, the bars are omitted for the sake of brevity.
Table 1. Scales used to render the various quantities dimensionless in § 3: cylindrical coordinates
 $r$
and
$r$
and
 $z$
, arclength
$z$
, arclength
 $s$
, surface area
$s$
, surface area
 $S$
, temperature difference
$S$
, temperature difference
 $T-T_{{sat}}$
, evaporation flux density
$T-T_{{sat}}$
, evaporation flux density
 $j$
(
$j$
(
 $\mathrm {kg\, m^-{^2} s^-{^1}}$
), evaporation rate
$\mathrm {kg\, m^-{^2} s^-{^1}}$
), evaporation rate
 $J$
(
$J$
(
 $\mathrm {kg\, s^-{^1}}$
), evaporative velocity
$\mathrm {kg\, s^-{^1}}$
), evaporative velocity
 $\boldsymbol {v}$
and pressure
$\boldsymbol {v}$
and pressure
 $p$
fields and evaporation/levitation force
$p$
fields and evaporation/levitation force
 $F_{{ev}}$
. The square brackets denote the scale of the quantity inside.
$F_{{ev}}$
. The square brackets denote the scale of the quantity inside.

3.1. Temperature field
As stipulated in § 2, the heat transport in the gas phase is conductive and quasi-steady. Thus, the thermal problem is decoupled from the evaporative velocity field, and the dimensionless temperature field
 $T$
is governed by the Laplace equation
$T$
is governed by the Laplace equation
 \begin{equation} \nabla ^2{T}=0. \end{equation}
It is subject to the boundary conditions
 \begin{align} T& = 1 \quad \ \text {on the hot substrate,} \\[-7pt] \nonumber \end{align}
 \begin{align} T& \to 1 \quad \text {far away from the droplet,} \\[-7pt] \nonumber \end{align}
 \begin{align} T& = 0 \quad \ \text {on the droplet surface.} \\[10pt] \nonumber \end{align}
Although an exact solution in bipolar coordinates can be found e.g. using the methods by Lebedev (Reference Lebedev1972), it is rather cumbersome so that we eventually opt for a numerical solution using COMSOL Multiphysics.
The results of the simulations are shown in figure 2(a) for three different values of the separating distance
 $\delta$
: a large droplet very close to the substrate with
$\delta$
: a large droplet very close to the substrate with
 $\delta = 0.1$
; a droplet at a distance from the substrate comparable to its radius with
$\delta = 0.1$
; a droplet at a distance from the substrate comparable to its radius with
 $\delta = 1$
; and a small droplet beginning to be far away from the substrate with
$\delta = 1$
; and a small droplet beginning to be far away from the substrate with
 $\delta =5$
. One immediately observes that, at small
$\delta =5$
. One immediately observes that, at small
 $\delta$
, the temperature difference is squeezed into a thin film between the droplet and the substrate. At large
$\delta$
, the temperature difference is squeezed into a thin film between the droplet and the substrate. At large
 $\delta$
, the temperature field approaches a spherically symmetric one, as expected. Other results displayed in figure 2 will be discussed later.
$\delta$
, the temperature field approaches a spherically symmetric one, as expected. Other results displayed in figure 2 will be discussed later.

Figure 2. (a) Dimensionless temperature (right) and velocity (left) fields for various values of
 $\delta$
. Streamlines are also shown by white lines (left). (b) Corresponding profiles of the dimensionless evaporation flux
$\delta$
. Streamlines are also shown by white lines (left). (b) Corresponding profiles of the dimensionless evaporation flux
 $j$
along the droplet surface as a function of the dimensionless arclength
$j$
along the droplet surface as a function of the dimensionless arclength
 $s$
(
$s$
(
 $s=0$
at the droplet apex,
$s=0$
at the droplet apex,
 $s=\pi$
at its lowest point; the plot is formally continued up to
$s=\pi$
at its lowest point; the plot is formally continued up to
 $s=2\pi$
back to the apex for aesthetic purposes). Insets are simply zooms of the main plot.
$s=2\pi$
back to the apex for aesthetic purposes). Insets are simply zooms of the main plot.
3.2. Evaporation rate
At the droplet surface, the evaporation mass flux
 $j$
$j$
 $[\mathrm {kg\, m^-{^2}\, s^-{^1}}]$
is at the expense of the heat coming from the superheated surroundings through the vapour phase:
$[\mathrm {kg\, m^-{^2}\, s^-{^1}}]$
is at the expense of the heat coming from the superheated surroundings through the vapour phase:
 $j= ({\lambda _v}/{\mathcal {L}}) \boldsymbol {n}\cdot \boldsymbol {\nabla } T$
, where
$j= ({\lambda _v}/{\mathcal {L}}) \boldsymbol {n}\cdot \boldsymbol {\nabla } T$
, where
 $\boldsymbol {n}$
is the (external) unit normal vector. In dimensionless terms (cf. table 1), this reads
$\boldsymbol {n}$
is the (external) unit normal vector. In dimensionless terms (cf. table 1), this reads
 \begin{equation} j = \boldsymbol {n} \cdot \boldsymbol {\nabla }{T} . \end{equation}
Using the temperature field computed in § 3.1, the profiles of the evaporation flux
 $j$
are calculated from (3.6) and shown in figure 2(b). One can appreciate that, due to the presence of the hot substrate,
$j$
are calculated from (3.6) and shown in figure 2(b). One can appreciate that, due to the presence of the hot substrate,
 $j$
is maximum at the base and decreases towards the apex, where the minimum is attained. The closer the droplet is to the substrate (the smaller
$j$
is maximum at the base and decreases towards the apex, where the minimum is attained. The closer the droplet is to the substrate (the smaller
 $\delta$
is), the more the profile of
$\delta$
is), the more the profile of
 $j$
is non-uniform and the values of
$j$
is non-uniform and the values of
 $j$
are large. At small
$j$
are large. At small
 $\delta$
, one obviously obtains max(
$\delta$
, one obviously obtains max(
 $j$
)
$j$
)
 $\propto 1/\delta$
(heat conduction across a thin vapour layer). When the relative droplet height
$\propto 1/\delta$
(heat conduction across a thin vapour layer). When the relative droplet height
 $\delta$
increases, the non-uniformity of
$\delta$
increases, the non-uniformity of
 $j$
weakens and the average of
$j$
weakens and the average of
 $j$
decreases. Eventually,
$j$
decreases. Eventually,
 $j$
tends to a uniform value of 1 for
$j$
tends to a uniform value of 1 for
 $\delta \gg 1$
(as for a droplet in an unbounded medium).
$\delta \gg 1$
(as for a droplet in an unbounded medium).
The (global) evaporation rate
 $J$
can be directly deduced by integrating the evaporation flux all over the droplet surface
$J$
can be directly deduced by integrating the evaporation flux all over the droplet surface
 \begin{equation} J=\iint j\, \mathrm{d}S . \end{equation}
Figure 3 reports the computed values of
 $J$
as a function of
$J$
as a function of
 $\delta$
. As expected from the knowledge of the
$\delta$
. As expected from the knowledge of the
 $j$
behaviour,
$j$
behaviour,
 $J$
diverges as
$J$
diverges as
 $\delta \to 0$
and decreases to saturate at
$\delta \to 0$
and decreases to saturate at
 $4\pi$
as
$4\pi$
as
 $\delta \to +\infty$
. Such asymptotic behaviours are investigated in detail in Appendices C1 and C2 and also represented in figure 3. A good simple approximation of the numerical data for
$\delta \to +\infty$
. Such asymptotic behaviours are investigated in detail in Appendices C1 and C2 and also represented in figure 3. A good simple approximation of the numerical data for
 $J$
, respecting the leading-order asymptotic behaviours, is given by
$J$
, respecting the leading-order asymptotic behaviours, is given by
 \begin{equation} J(\delta )=4\pi \left [ 1+\frac {1}{2} \ln \left (1+\frac {1}{\delta }\right ) \right ] , \end{equation}
where a maximum deviation from the data does not exceed 2.7 %. However, a more precise fit is also provided for reference in Appendix B1.

Figure 3. Evaporation rate
 $J$
(dimensionless) as a function of the relative droplet height
$J$
(dimensionless) as a function of the relative droplet height
 $\delta$
. Numerical results (blue open circles) are fairly well approximated by (3.8) (red line). Black dashed lines correspond to the asymptotic behaviours (Appendix C).
$\delta$
. Numerical results (blue open circles) are fairly well approximated by (3.8) (red line). Black dashed lines correspond to the asymptotic behaviours (Appendix C).
3.3. Velocity field
In accordance with the approach followed in the present paper (§ 2), the evaporative flow field, generated by droplet evaporation, is considered in the Stokes and quasi-steady approximation. Thus, we proceed from the continuity and Stokes equations
 \begin{eqnarray} \boldsymbol {\nabla }\boldsymbol {\cdot }{{\boldsymbol {v}}}&=&0, \end{eqnarray}
 \begin{eqnarray} \nabla ^2{{{\boldsymbol {v}}}}-\boldsymbol {\nabla }{p}&=&0. \end{eqnarray}
The following boundary conditions are used:
 \begin{align} {\boldsymbol {v}}&=0 \quad \quad \ \text {on the hot substrate,} \\[-6pt] \nonumber \end{align}
 \begin{align} {\boldsymbol {v}}&\to 0 \quad \quad \text {far away from the droplet,} \\[-6pt] \nonumber \end{align}
 \begin{align} {\boldsymbol {v}} \cdot \boldsymbol {\tau } &=0 \quad \text {and}\quad {\boldsymbol {v}} \cdot \boldsymbol {n} =j \quad \text {on the droplet surface.} \\[10pt] \nonumber \end{align}
Here,
 $\boldsymbol {v}$
and
$\boldsymbol {v}$
and
 $p$
are the dimensionless velocity and pressure fields in the vapour (cf. the scales in table 1), and
$p$
are the dimensionless velocity and pressure fields in the vapour (cf. the scales in table 1), and
 $\boldsymbol {\tau }$
is the unit tangential vector. In the first boundary condition (3.13), a possible internal flow in the droplet is neglected relative to the velocity scale in the vapour, hence no slip. The last boundary condition (3.13) contains the driving factor of the flow field, where the normal velocity at the droplet surface is determined by the evaporation flux (3.6), which is in turn determined by the temperature field obtained from the formulation (3.2)–(3.5) in § 3.1. Similarly to § 3.1, this hydrodynamic part of the problem is also solved numerically using COMSOL Multiphysics.
$\boldsymbol {\tau }$
is the unit tangential vector. In the first boundary condition (3.13), a possible internal flow in the droplet is neglected relative to the velocity scale in the vapour, hence no slip. The last boundary condition (3.13) contains the driving factor of the flow field, where the normal velocity at the droplet surface is determined by the evaporation flux (3.6), which is in turn determined by the temperature field obtained from the formulation (3.2)–(3.5) in § 3.1. Similarly to § 3.1, this hydrodynamic part of the problem is also solved numerically using COMSOL Multiphysics.
The computation results for the vapour velocity fields are added into figure 2(a), mirroring the temperature fields and also displaying the streamlines. For large relative heights
 $\delta$
, the streamlines remain straight near the droplet’s surface, indicating that the flow is almost spherically symmetric there and only slightly disturbed by the substrate. Farther from the droplet, the streamlines are significantly bent due to the substrate presence. Higher velocity field values are attained for smaller
$\delta$
, the streamlines remain straight near the droplet’s surface, indicating that the flow is almost spherically symmetric there and only slightly disturbed by the substrate. Farther from the droplet, the streamlines are significantly bent due to the substrate presence. Higher velocity field values are attained for smaller
 $\delta$
. This is not only due to a profound maximum in the evaporation flux due to the substrate proximity at small
$\delta$
. This is not only due to a profound maximum in the evaporation flux due to the substrate proximity at small
 $\delta$
(as in figure 2
b1), but also additionally due to a confinement effect in a thin vapour layer between the droplet and the substrate, when the longitudinal velocity becomes even higher than the evaporation-flux-driven normal one at the droplet surface.
$\delta$
(as in figure 2
b1), but also additionally due to a confinement effect in a thin vapour layer between the droplet and the substrate, when the longitudinal velocity becomes even higher than the evaporation-flux-driven normal one at the droplet surface.

Figure 4. Evaporative force
 $F_{{ev}}$
(dimensionless, in terms of
$F_{{ev}}$
(dimensionless, in terms of
 $\delta ^2 F_{{ev}}$
) as a function of the relative droplet height
$\delta ^2 F_{{ev}}$
) as a function of the relative droplet height
 $\delta$
. Numerical results (blue open circles) are well approximated by (3.15) (red line). Black dashed lines correspond to the asymptotic behaviours.
$\delta$
. Numerical results (blue open circles) are well approximated by (3.15) (red line). Black dashed lines correspond to the asymptotic behaviours.
3.4. Levitation force
The bending and asymmetry of the evaporative flow due to the substrate give rise to a hydrodynamic force acting on the evaporating droplet in the sense of its repulsion from the substrate. We refer to it as an evaporative force
 $F_{{ev}}$
. In our configuration (figure 1), this amounts to a force acting on the droplet vertically upwards (along the
$F_{{ev}}$
. In our configuration (figure 1), this amounts to a force acting on the droplet vertically upwards (along the
 $z$
axis), which is responsible for droplet levitation against gravity. The force balance on the droplet and its levitation height are considered in § 4 later on. Here we simply calculate
$z$
axis), which is responsible for droplet levitation against gravity. The force balance on the droplet and its levitation height are considered in § 4 later on. Here we simply calculate
 $F_{{ev}}$
in dimensionless terms (cf. the scales in table 1) as a function of the relative height
$F_{{ev}}$
in dimensionless terms (cf. the scales in table 1) as a function of the relative height
 $\delta$
. Namely, we evaluate
$\delta$
. Namely, we evaluate
 \begin{equation} F_{{ev}} = \left (\iint \limits _S (-p \boldsymbol {n} +(\boldsymbol {\nabla }{{\boldsymbol {v}}}+\boldsymbol {\nabla }{{\boldsymbol {v}}}^{\intercal })\cdot \boldsymbol {n})\, \textrm {d} S \right ) \cdot \boldsymbol {e_z} \end{equation}
using the velocity and pressure fields computed in § 3.3, where
 $\boldsymbol {e_z}$
is a unit vector along
$\boldsymbol {e_z}$
is a unit vector along
 $z$
.
$z$
.
The result is reported in figure 4 in terms of
 $F_{{ev}} \delta ^2$
. The overall tendency is
$F_{{ev}} \delta ^2$
. The overall tendency is
 $F_{{ev}}\propto \delta ^{-2}$
, as is already known in the literature (Celestini et al. Reference Celestini, Frisch and Pomeau2012; Pomeau et al. Reference Pomeau, Le Berre, Celestini and Frisch2012). However, it is less known that the prefactor is different in the limits
$F_{{ev}}\propto \delta ^{-2}$
, as is already known in the literature (Celestini et al. Reference Celestini, Frisch and Pomeau2012; Pomeau et al. Reference Pomeau, Le Berre, Celestini and Frisch2012). However, it is less known that the prefactor is different in the limits
 $\delta \to 0$
and
$\delta \to 0$
and
 $\delta \to +\infty$
. For instance, Celestini et al. (Reference Celestini, Frisch and Pomeau2012) attempted to fit the experimental data using a single prefactor. We obtain a prefactor
$\delta \to +\infty$
. For instance, Celestini et al. (Reference Celestini, Frisch and Pomeau2012) attempted to fit the experimental data using a single prefactor. We obtain a prefactor
 $3\pi$
as
$3\pi$
as
 $\delta \to 0$
, which can be deduced from the lubrication approximation (cf. Pomeau et al. Reference Pomeau, Le Berre, Celestini and Frisch2012; Sobac et al. 2021, see also Appendix C3), although Pomeau et al. (Reference Pomeau, Le Berre, Celestini and Frisch2012) obtained
$\delta \to 0$
, which can be deduced from the lubrication approximation (cf. Pomeau et al. Reference Pomeau, Le Berre, Celestini and Frisch2012; Sobac et al. 2021, see also Appendix C3), although Pomeau et al. (Reference Pomeau, Le Berre, Celestini and Frisch2012) obtained
 $3\pi /8$
here (erroneously, in our opinion). In contrast, the prefactor is
$3\pi /8$
here (erroneously, in our opinion). In contrast, the prefactor is
 $6\pi$
as
$6\pi$
as
 $\delta \to +\infty$
, which is confirmed by an asymptotic analysis described in Appendix C4, where a number of contributions in terms of the droplet–substrate interaction are followed through. The following simple expression nicely approximates our numerical result while respecting the prefactor values in both limits:
$\delta \to +\infty$
, which is confirmed by an asymptotic analysis described in Appendix C4, where a number of contributions in terms of the droplet–substrate interaction are followed through. The following simple expression nicely approximates our numerical result while respecting the prefactor values in both limits:
 \begin{equation} F_{{ev}}(\delta )= \frac {3 \pi }{\delta ^2}\, \frac {1+2\delta }{1+\delta } , \end{equation}
which is also shown in figure 4. It covers the numerical data with a relative error of 1.4 %, whereas a more precise fit is provided for reference in Appendix B2. In what follows, for purely presentational reasons, we shall use the simple-form approximations like (3.8) and (3.15), whose precision is deemed to be already rather satisfactory.
3.5. Validity of assumptions
-
1. Negligible advection. We start with the estimation of an evaporative Péclet number
 $\textit{Pe}=[{\boldsymbol {v}}] R/\alpha _v$
, where the evaporative velocity scale
$[{\boldsymbol {v}}]$
from table 1 is used. We obtain(3.16)which incidentally turns out to be a version of the Jakob number often used in the literature. For the typical
\begin{equation} \textit{Pe}=\frac {c_{p,v} \Delta T}{{\mathcal {L}}} , \end{equation}
$\Delta T$
value (cf. § 2) and parameter values (cf. the first row of table 3 in Appendix A), we obtain
$\textit{Pe} \approx 0.19\ll 1$
, which justifies the approximation used in § 3.1.
$\textit{Pe}=[{\boldsymbol {v}}] R/\alpha _v$
, where the evaporative velocity scale
$[{\boldsymbol {v}}]$
from table 1 is used. We obtain(3.16)which incidentally turns out to be a version of the Jakob number often used in the literature. For the typical
\begin{equation} \textit{Pe}=\frac {c_{p,v} \Delta T}{{\mathcal {L}}} , \end{equation}
$\Delta T$
value (cf. § 2) and parameter values (cf. the first row of table 3 in Appendix A), we obtain
$\textit{Pe} \approx 0.19\ll 1$
, which justifies the approximation used in § 3.1.
-
2. Stokes approximation. Likewise, the Reynolds number is
$\textit{Re}=\rho _v R [{\boldsymbol {v}}] / \mu _v=\textit{Pe} \,\textit{Pr}^{-1}$
, where
$\textit{Pr}=\mu _v/(\rho _v\alpha _v)$
is the Prandtl number. As
$\textit{Pr}=0.71$
(cf. ibid), we obtain
$\textit{Re}\approx 0.26\ll 1$
, confirming the approximation used in § 3.3. -
3. Negligible natural convection. This is related to small values of the Grashof number at the droplet scale
(3.17)(written in this form given that the variations of
\begin{equation} {\textit{Gr}}=\frac {\rho _v g R^3}{\mu _v\nu _v} ;\end{equation}
$\rho _v$
are here of the order of
$\rho _v$
itself). One typically obtains
${\textit{Gr}}\lt 0.01$
for our small droplets (
$R\lesssim 50\,\unicode{x03BC} \text {m}$
).
-
4. Gas phase quasi-steadiness. The results of the present section imply the quasi-steadiness of the temperature and velocity fields in the entire region between the droplet and the substrate, which may be especially questionable for large levitation heights
$h$
. The appropriate thermal and viscous time scales can be chosen as
$\tau _{{th}}=\max (R,h)^2/\alpha _v$
and
$\tau _{{vis}}=\rho _v \max (R,h)^2/\mu _v$
. The quasi-steadiness takes place when
$\tau _{{th}}\ll \tau$
and
$\tau _{{vis}}\ll \tau$
, where
$\tau$
is the typical time scale of the process. As
$\textit{Pr}=O(1)$
here, we just limit our attention to the first one of these conditions for the sake of brevity, and hence(3.18)An immediately obvious time scale of the process is here the evaporation time scale of the droplet
\begin{equation} \frac {\max (R,h)^2}{\alpha _v}\ll \tau . \end{equation}
$\tau _{{ev}}=\rho _l R^3/[J]$
(cf. table 1 for
$[J]$
), i.e.(3.19)Using it as
\begin{equation} \tau _{{ev}}=\frac {\rho _l {\mathcal {L}} R^2}{\lambda _v \Delta T}=\frac {\rho _l}{\rho _v}\frac {1}{\textit{Pe}}\frac {R^2}{\alpha _v} . \end{equation}
$\tau =\tau _{{ev}}$
in (3.18), we arrive at(3.20)Given that
\begin{equation} \max (1, \delta ^2)\ll \frac {\rho _l}{\rho _v} \frac {1}{\textit{Pe}} . \end{equation}
$\rho _l\gg \rho _v$
and
$\textit{Pe}\ll 1$
here, the condition (3.20) leaves a considerable margin for possible large values of the relative height
$\delta =h/R$
. We shall come back to it later on, after having considered concrete solutions for
$h$
.


4. Levitation and take-off: quasi-steady approach
4.1. Formal application of the quasi-steady approach
A vertical balance of the (evaporative) levitation force (3.15) against the droplet weight directly yields the equation for the levitation height of the droplet
 $h$
as a function of its radius
$h$
as a function of its radius
 $R$
, which we write in dimensional form:
$R$
, which we write in dimensional form:
 \begin{equation} 3\pi \frac {\mu _v\lambda _v \Delta T}{\rho _v \mathcal {L}} \frac {R^2}{h^2}\, \frac {R+2 h}{R+h}=\frac {4\pi }{3}\rho _l g R^3 , \end{equation}
where we have used the scale from table 1 and the definition (2.1). There exists a single natural length scale
 $\ell _*$
, the non-dimensionalisation with which renders (4.1) parameter-free:
$\ell _*$
, the non-dimensionalisation with which renders (4.1) parameter-free:
 \begin{equation} \frac {1}{\hat {h}^2}\, \frac {\hat {R}+2 \hat {h}}{\hat {R}+\hat {h}}=\frac {4}{9} \hat {R}\, , \end{equation}
where
 \begin{equation} [\hat {R}]=[\hat {h}]=\left (\frac {\mu _v\lambda _v \Delta T}{\rho _v \rho _l g \mathcal {L}}\right )^{1/3}\equiv \ell _* ,\quad \hat {R}=\frac {R}{[\hat {R}]} ,\quad \hat {h}=\frac {h}{[\hat {h}]}\, . \end{equation}
The solution of (4.2) is shown in figure 5(a) and adheres to the following asymptotic behaviour:
 \begin{align} \hat {h}&=\frac {3}{2}\frac {1}{{\hat {R}^{1/2}}}\, \, \, \, \, \, \text {i.e.}\, \, \delta =\frac {3}{2}\frac {1}{{\hat {R}^{3/2}}}\, \, \, \, \, \, \text {as}\, \hat {R}\to +\infty , \end{align}
 \begin{align} \hat {h}& = \frac {3}{\sqrt {2}}\frac {1}{{\hat {R}^{1/2}}}\, \, \text {i.e.}\, \, \delta =\frac {3}{\sqrt {2}}\frac {1}{{\hat {R}^{3/2}}}\,\, \text {as}\, \hat {R}\to 0 . \\[6pt] \nonumber \end{align}
The length scale
 $\ell _*$
indicates the characteristic size
$\ell _*$
indicates the characteristic size
 $R\sim \ell _*$
at which the droplet takes off at a height of the order of itself, with
$R\sim \ell _*$
at which the droplet takes off at a height of the order of itself, with
 $h \sim R$
(i.e.
$h \sim R$
(i.e.
 $\delta \sim 1$
). At smaller sizes (
$\delta \sim 1$
). At smaller sizes (
 $R\ll \ell _*$
), the droplet soars even higher (
$R\ll \ell _*$
), the droplet soars even higher (
 $h\gg \ell _*\gg R$
,
$h\gg \ell _*\gg R$
,
 $\delta \gg 1$
), whereas at larger sizes (
$\delta \gg 1$
), whereas at larger sizes (
 $R\gg \ell _*$
), the droplet levitates lower (
$R\gg \ell _*$
), the droplet levitates lower (
 $h\ll \ell _*\ll R$
,
$h\ll \ell _*\ll R$
,
 $\delta \ll 1$
). Typically,
$\delta \ll 1$
). Typically,
 $\ell _*$
is in the range of a few tens of micrometres. For our reference case of a water droplet on a superheated substrate with
$\ell _*$
is in the range of a few tens of micrometres. For our reference case of a water droplet on a superheated substrate with
 $\Delta T=300\;^{\circ }$
C, we obtain
$\Delta T=300\;^{\circ }$
C, we obtain
 $\ell _*=28.46\,\unicode{x03BC}$
m, which is much smaller than the capillary length
$\ell _*=28.46\,\unicode{x03BC}$
m, which is much smaller than the capillary length
 $\ell _c=\sqrt {\gamma /(\rho _l g)}$
(
$\ell _c=\sqrt {\gamma /(\rho _l g)}$
(
 $\gamma$
being the liquid–air surface tension,
$\gamma$
being the liquid–air surface tension,
 $\ell _c\sim 2.5\,\mathrm {mm}$
for water). This ‘take-off scale’
$\ell _c\sim 2.5\,\mathrm {mm}$
for water). This ‘take-off scale’
 $\ell _*$
has earlier been pointed out by Celestini et al. (Reference Celestini, Frisch and Pomeau2012) and Pomeau et al. (Reference Pomeau, Le Berre, Celestini and Frisch2012) (their notation
$\ell _*$
has earlier been pointed out by Celestini et al. (Reference Celestini, Frisch and Pomeau2012) and Pomeau et al. (Reference Pomeau, Le Berre, Celestini and Frisch2012) (their notation
 $R_l$
) as the scale at which a drastic take-off takes place (although note that a mere increase of
$R_l$
) as the scale at which a drastic take-off takes place (although note that a mere increase of
 $h$
as
$h$
as
 $R$
decreases already starts from much larger sizes
$R$
decreases already starts from much larger sizes
 $R$
, cf. Sobac et al. 2021, as well as § 8 here). They also interpret it as the droplet size starting from and below which the lubrication approximation in the vapour film between the droplet and the substrate becomes invalid (since
$R$
, cf. Sobac et al. 2021, as well as § 8 here). They also interpret it as the droplet size starting from and below which the lubrication approximation in the vapour film between the droplet and the substrate becomes invalid (since
 $h\ll R$
ceases indeed to hold). Note that
$h\ll R$
ceases indeed to hold). Note that
 $h=R$
for
$h=R$
for
 $R=3/2\, \ell _*$
.
$R=3/2\, \ell _*$
.

Figure 5. (a) Relative height as a function of the droplet radius as predicted by the quasi-steady model. Full solution (solid blue line, ‘master curve’) and the asymptotic behaviours for smaller and larger radii (dashed and dotted purple lines, respectively). The log–log inset highlights the dominant power law and the prefactor change between the two limits. (b) First comparison with the experimental data of Celestini et al. (Reference Celestini, Frisch and Pomeau2012) for water (with
 $\Delta T=300\;^{\circ }$
C).
$\Delta T=300\;^{\circ }$
C).
Similarly to what was commented for
 $F_{{ev}}$
in § 3.4, the overall tendency
$F_{{ev}}$
in § 3.4, the overall tendency
 $h\sim R^{-1/2}$
(or
$h\sim R^{-1/2}$
(or
 $h/R\sim R^{-3/2}$
) has been well known since Celestini et al. (Reference Celestini, Frisch and Pomeau2012) and Pomeau et al. (Reference Pomeau, Le Berre, Celestini and Frisch2012), who first pointed out this exponent. However, we here calculate the prefactor and point out that it is actually not fully constant, as highlighted in the inset of figure 5(a) and further put into evidence by the two different limiting values in (4.4) and (4.5).
$h/R\sim R^{-3/2}$
) has been well known since Celestini et al. (Reference Celestini, Frisch and Pomeau2012) and Pomeau et al. (Reference Pomeau, Le Berre, Celestini and Frisch2012), who first pointed out this exponent. However, we here calculate the prefactor and point out that it is actually not fully constant, as highlighted in the inset of figure 5(a) and further put into evidence by the two different limiting values in (4.4) and (4.5).
A first comparison with experiment is undertaken in figure 5(b), where we focus our attention on just the upper layer of experimental points, while the points lower than that are deemed to belong to some transients (see also a remark in § 7 later). It is important to recall that these experiments dealt with small droplets, typically ranging in radius from
 $1$
to
$1$
to
 $30\,\unicode{x03BC} \mathrm {m}$
, which is of the order of or smaller than
$30\,\unicode{x03BC} \mathrm {m}$
, which is of the order of or smaller than
 $\ell _*$
here. For this size range (
$\ell _*$
here. For this size range (
 $\hat {R}\lesssim 1$
), specific to take-off observations, the full solution of (4.2) already practically coincides with the asymptotic limit (4.5), cf. figure 5. While this seems to agree well with experiment for
$\hat {R}\lesssim 1$
), specific to take-off observations, the full solution of (4.2) already practically coincides with the asymptotic limit (4.5), cf. figure 5. While this seems to agree well with experiment for
 $15\,\unicode{x03BC} \mathrm {m}\lesssim R\lesssim 30\,\unicode{x03BC} \mathrm {m}$
, an overprediction is nonetheless observed as the droplet size decreases below
$15\,\unicode{x03BC} \mathrm {m}\lesssim R\lesssim 30\,\unicode{x03BC} \mathrm {m}$
, an overprediction is nonetheless observed as the droplet size decreases below
 $R\lesssim 15\,\unicode{x03BC} \mathrm {m}$
. Astonishingly, we observe that it is rather the asymptotic behaviour (4.4) that starts to get closer to the experimental points even if (4.4), with the prefactor it contains, is appropriate in the limit of larger droplets (and not the smaller ones we are discussing right now). We shall come later to what will be the right explanation here.
$R\lesssim 15\,\unicode{x03BC} \mathrm {m}$
. Astonishingly, we observe that it is rather the asymptotic behaviour (4.4) that starts to get closer to the experimental points even if (4.4), with the prefactor it contains, is appropriate in the limit of larger droplets (and not the smaller ones we are discussing right now). We shall come later to what will be the right explanation here.
The droplet radius
 $R$
decreases over time by evaporation (rather than just being a given constant parameter), and hence
$R$
decreases over time by evaporation (rather than just being a given constant parameter), and hence
 $h$
, related to
$h$
, related to
 $R$
by (4.1), is also a function of time. The steady force balance (4.1) or (4.2) is then assumed to be valid in a quasi-steady sense, and
$R$
by (4.1), is also a function of time. The steady force balance (4.1) or (4.2) is then assumed to be valid in a quasi-steady sense, and
 $R(t)$
and
$R(t)$
and
 $h(t)$
follow the solid curve of figure 5 as time goes on. The mass of the droplet
$h(t)$
follow the solid curve of figure 5 as time goes on. The mass of the droplet
 $({4\pi }/{3}) \rho _l R^3$
decreases in time at an evaporation rate given by (3.8) with the scale from table 1. This balance gives rise to the following equation for the droplet radius evolution:
$({4\pi }/{3}) \rho _l R^3$
decreases in time at an evaporation rate given by (3.8) with the scale from table 1. This balance gives rise to the following equation for the droplet radius evolution:
 \begin{equation} \rho _l R\, \frac {\mathrm {d} R}{\mathrm {d} t}=-\frac {\lambda _v \Delta T}{\mathcal {L}} \left [ 1+\frac {1}{2} \ln \left (1+\frac {R}{h}\right ) \right ] . \end{equation}
Using the time scale
 \begin{equation} [\hat {t}]=\frac {\rho _l \mathcal {L} {\ell _*^2}}{\lambda _v \Delta T}=\frac {\rho _l}{\rho _v}\frac {1}{\textit{Pe}}\frac {\ell _*^2}{\alpha _v}\equiv \tau _*\, ,\end{equation}
alongside the scales (4.3), equation (4.6) is rendered free of any parameters similarly to (4.2). Namely, we arrive at
 \begin{equation} \hat {R}\, \frac {\mathrm {d} \hat {R}}{\mathrm {d} \hat {t}}= -1-\frac {1}{2} \ln \left (1+\frac {\hat {R}}{\hat {h}}\right ) . \end{equation}
Now the dimensionless evolution problem for
 $\hat {R}(\hat {t})$
and
$\hat {R}(\hat {t})$
and
 $\hat {h}(\hat {t})$
is defined by a system of two coupled equations, (4.2) and (4.8), for which the initial conditions
$\hat {h}(\hat {t})$
is defined by a system of two coupled equations, (4.2) and (4.8), for which the initial conditions
 $\hat {R}=\hat {R}_0$
and
$\hat {R}=\hat {R}_0$
and
 $\hat {h}=\hat {h}_0$
at
$\hat {h}=\hat {h}_0$
at
 $\hat {t}=0$
are posed with
$\hat {t}=0$
are posed with
 $\hat {R}_0$
and
$\hat {R}_0$
and
 $\hat {h}_0$
not being independent but rather related by (4.2). Figure 6 illustrates the (numerically obtained) solution for various initial droplet radii
$\hat {h}_0$
not being independent but rather related by (4.2). Figure 6 illustrates the (numerically obtained) solution for various initial droplet radii
 $\hat {R}_0=\{1/3,1/2,1,2,3\}$
. Evidently, the curves demonstrate that
$\hat {R}_0=\{1/3,1/2,1,2,3\}$
. Evidently, the curves demonstrate that
 $\hat {R}$
decreases over time due to evaporation until extinction, with larger droplets exhibiting longer lifespans. Concurrently,
$\hat {R}$
decreases over time due to evaporation until extinction, with larger droplets exhibiting longer lifespans. Concurrently,
 $\hat {h}$
increases over time as the droplet size decreases, larger droplets being closer to the substrate at the initial time in accordance with (4.2). It is important to note that, within the present quasi-steady description, a Leidenfrost droplet takes off reaching an infinite height
$\hat {h}$
increases over time as the droplet size decreases, larger droplets being closer to the substrate at the initial time in accordance with (4.2). It is important to note that, within the present quasi-steady description, a Leidenfrost droplet takes off reaching an infinite height
 $\hat {h}\to +\infty$
at the end of its life (as
$\hat {h}\to +\infty$
at the end of its life (as
 $\hat {R}\to 0$
), in accordance with (4.5).
$\hat {R}\to 0$
), in accordance with (4.5).
In the inset,
 $(\hat {R}/\hat {R}_0)^2$
is plotted as a function of
$(\hat {R}/\hat {R}_0)^2$
is plotted as a function of
 $\hat {t}/\hat {t}_{{ev}}^{\infty }$
in order to highlight the evaporative behaviour of a spherical Leidenfrost droplet as compared with the well-known limit case of a spherical droplet suspended in an unbounded gas medium. Here,
$\hat {t}/\hat {t}_{{ev}}^{\infty }$
in order to highlight the evaporative behaviour of a spherical Leidenfrost droplet as compared with the well-known limit case of a spherical droplet suspended in an unbounded gas medium. Here,
 $\hat {t}_{{ev}}^{\infty }=(\hat {R}_0)^2/2$
is the dimensionless evaporation time of such a freely suspended droplet (which can be derived from (4.8) in the limit
$\hat {t}_{{ev}}^{\infty }=(\hat {R}_0)^2/2$
is the dimensionless evaporation time of such a freely suspended droplet (which can be derived from (4.8) in the limit
 $\delta =\hat {h}/\hat {R}\to +\infty$
). Owing to the interaction with the superheated substrate, appearing through the logarithmic term in (4.8), the well-known
$\delta =\hat {h}/\hat {R}\to +\infty$
). Owing to the interaction with the superheated substrate, appearing through the logarithmic term in (4.8), the well-known
 $R^2$
-law is recovered only for large values of
$R^2$
-law is recovered only for large values of
 $\hat {h}_0$
. Thus,
$\hat {h}_0$
. Thus,
 $\hat {R}^2$
generally does not linearly decrease in time, while these droplets evaporate faster than their freely suspended counterparts due to the proximity of the superheated substrate.
$\hat {R}^2$
generally does not linearly decrease in time, while these droplets evaporate faster than their freely suspended counterparts due to the proximity of the superheated substrate.
Needless to note that, by parametrically plotting
 $\hat {h}(\hat {t})/\hat {R}(\hat {t})$
or
$\hat {h}(\hat {t})/\hat {R}(\hat {t})$
or
 $\hat {h}(\hat {t})$
as a function of
$\hat {h}(\hat {t})$
as a function of
 $\hat {R}(\hat {t})$
(
$\hat {R}(\hat {t})$
(
 $\hat{t}$
being the parameter), we retrieve the same ‘master’ curve as depicted in figure 5. Within the present quasi-steady approach, such a master curve is just trivially given by an algebraic equation like (4.1) or (4.2). However, this may become less trivial in what follows.
$\hat{t}$
being the parameter), we retrieve the same ‘master’ curve as depicted in figure 5. Within the present quasi-steady approach, such a master curve is just trivially given by an algebraic equation like (4.1) or (4.2). However, this may become less trivial in what follows.

Figure 6. Dimensionless evolutions of the radius
 $\hat {R}$
and the height
$\hat {R}$
and the height
 $\hat {h}$
of a spherical Leidenfrost droplet over time
$\hat {h}$
of a spherical Leidenfrost droplet over time
 $\hat {t}$
computed by the quasi-steady model (coupled 4.2 and 4.6) for initial droplet radii
$\hat {t}$
computed by the quasi-steady model (coupled 4.2 and 4.6) for initial droplet radii
 $\hat {R}_0=\{1/3,1/2,1,2,3\}$
(from dark to light blue). The corresponding initial quasi-steady heights are
$\hat {R}_0=\{1/3,1/2,1,2,3\}$
(from dark to light blue). The corresponding initial quasi-steady heights are
 $\hat {h}_0=\{3.60, 2.89, 1.93, 1.25, 0.97\}$
. The inset serves to illustrate the extents to which the
$\hat {h}_0=\{3.60, 2.89, 1.93, 1.25, 0.97\}$
. The inset serves to illustrate the extents to which the
 $R^2$
-law holds and to which the evaporation is accelerated by the superheated substrate, where the time is normalised to the evaporation time of a freely suspended droplet.
$R^2$
-law holds and to which the evaporation is accelerated by the superheated substrate, where the time is normalised to the evaporation time of a freely suspended droplet.
4.2. Validity of assumptions
The quasi-steady result that the droplet soars to an infinite height at the end of its life, cf. (4.5) and figure 6(b), looks suspicious from the physical point of view. One can wonder whether the quasi-steadiness criterion (3.20) for the fields in the gas phase is still fulfilled in view of
 $\delta \to +\infty$
. Furthermore,
$\delta \to +\infty$
. Furthermore,
 $h\to +\infty$
also implies infinite velocity and acceleration (
$h\to +\infty$
also implies infinite velocity and acceleration (
 $\textrm {d}h/\textrm {d}t\to +\infty$
and
$\textrm {d}h/\textrm {d}t\to +\infty$
and
 $\textrm {d}^2 h/\textrm {d}t^2\to +\infty$
), and hence one can wonder whether the steady force balance such as (4.1) is still adequate when neglecting the drag (proportional to
$\textrm {d}^2 h/\textrm {d}t^2\to +\infty$
), and hence one can wonder whether the steady force balance such as (4.1) is still adequate when neglecting the drag (proportional to
 $\textrm {d}h/\textrm {d}t$
) and inertia (proportional to
$\textrm {d}h/\textrm {d}t$
) and inertia (proportional to
 $\textrm {d}^2 h/\textrm {d}t^2$
) forces on the droplet. Below, we make an estimation of those effects when the only source of unsteadiness is the evaporation of the droplet, i.e. when the time scale is
$\textrm {d}^2 h/\textrm {d}t^2$
) forces on the droplet. Below, we make an estimation of those effects when the only source of unsteadiness is the evaporation of the droplet, i.e. when the time scale is
 $\tau =\tau _{{ev}}$
as given by (3.19).
$\tau =\tau _{{ev}}$
as given by (3.19).
Disregarding numerical prefactors, the inertia, (Stokes) drag and levitation forces can be estimated as
 \begin{equation} \mathrm {inertia}\sim \rho _l R^3 \frac {h}{\tau _{{ev}}^2} ,\quad \mathrm {drag}\sim \mu _v R \frac {h}{\tau _{{ev}}} ,\quad \mathrm {levitation}\sim \frac {\mu _v\lambda _v \Delta T}{\rho _v \mathcal {L}} \frac {R^2}{h^2} , \end{equation}
where the estimation of the levitation force is just based on the left-hand side of (4.1). Using the expression (3.19) for
 $\tau _{{ev}}$
, one can immediately see that
$\tau _{{ev}}$
, one can immediately see that
 \begin{equation} \frac {\mathrm {inertia}}{\mathrm {drag}}\sim \textit{Pr}^{-1} \textit{Pe} .\end{equation}
As we have
 $\textit{Pr}\sim 1$
,
$\textit{Pr}\sim 1$
,
 $\textit{Pe}\ll 1$
here (cf. § 3.5), inertia can be disregarded against the drag in the present context with
$\textit{Pe}\ll 1$
here (cf. § 3.5), inertia can be disregarded against the drag in the present context with
 $\tau =\tau _{{ev}}$
(which does not exclude that inertia can be essential in other contexts, cf. § 7 later on). Then, it just remains to compare the drag and levitation forces. Using (4.9) on account of (3.19), one can obtain
$\tau =\tau _{{ev}}$
(which does not exclude that inertia can be essential in other contexts, cf. § 7 later on). Then, it just remains to compare the drag and levitation forces. Using (4.9) on account of (3.19), one can obtain
 \begin{equation} \frac {\mathrm {drag}}{\mathrm {levitation}}\sim \frac {\rho _v}{\rho _l} \left (\frac {h}{R}\right )^3. \end{equation}
Thus, the drag can be neglected in favour of a quasi-steady force balance like (4.1) provided that
 \begin{equation} \delta ^3\ll \frac {\rho _l}{\rho _v}. \end{equation}
Given that the liquid density is much greater then the vapour density (
 $\rho _l/\rho _v\gg 1$
), the condition (4.12) leaves quite a considerable margin for the present quasi-steady approach to be valid. It is only for sufficiently small droplets levitating too high (such that
$\rho _l/\rho _v\gg 1$
), the condition (4.12) leaves quite a considerable margin for the present quasi-steady approach to be valid. It is only for sufficiently small droplets levitating too high (such that
 $\delta \sim (\rho _l/\rho _v)^{1/3}$
) that it breaks down and the drag force should be incorporated (but still not the inertia force, according to the earlier estimations), as intuitively expected. Moreover, one can clearly see that the condition (4.12) is more restrictive in the realm of large
$\delta \sim (\rho _l/\rho _v)^{1/3}$
) that it breaks down and the drag force should be incorporated (but still not the inertia force, according to the earlier estimations), as intuitively expected. Moreover, one can clearly see that the condition (4.12) is more restrictive in the realm of large
 $\delta$
than (3.20), which is further reinforced by the fact that
$\delta$
than (3.20), which is further reinforced by the fact that
 $\textit{Pe}\ll 1$
. This means that, even when the drag force becomes important, the temperature and velocity fields between the droplet and the substrate can still be regarded as quasi-steady, and hence expressions like (3.8) and (3.15) are still valid. An analysis aiming at smaller
$\textit{Pe}\ll 1$
. This means that, even when the drag force becomes important, the temperature and velocity fields between the droplet and the substrate can still be regarded as quasi-steady, and hence expressions like (3.8) and (3.15) are still valid. An analysis aiming at smaller
 $R$
(and larger
$R$
(and larger
 $h$
) and incorporating the drag force is realised in § 5 and § 6 below.
$h$
) and incorporating the drag force is realised in § 5 and § 6 below.
In the opposite limit of larger
 $R$
(and smaller
$R$
(and smaller
 $h$
), the validity of the quasi-steady approach as used here is therefore not put into question. However, it is rather the full-sphericity assumption that becomes more restrictive, when (even still within
$h$
), the validity of the quasi-steady approach as used here is therefore not put into question. However, it is rather the full-sphericity assumption that becomes more restrictive, when (even still within
 $R\ll \ell _c$
and a practical sphericity of the most of the droplet) a small part of the droplet bottom gets flattened by gravity (Pomeau et al. Reference Pomeau, Le Berre, Celestini and Frisch2012), an essential effect from the Leidenfrost viewpoint. In this regard, the result (4.4) should be understood in an intermediate asymptotic sense, as valid for
$R\ll \ell _c$
and a practical sphericity of the most of the droplet) a small part of the droplet bottom gets flattened by gravity (Pomeau et al. Reference Pomeau, Le Berre, Celestini and Frisch2012), an essential effect from the Leidenfrost viewpoint. In this regard, the result (4.4) should be understood in an intermediate asymptotic sense, as valid for
 $R\gg \ell _*$
but
$R\gg \ell _*$
but
 $R$
still much smaller than the bottom-flattening scale. This will be considered in more detail in § 8.
$R$
still much smaller than the bottom-flattening scale. This will be considered in more detail in § 8.
5. Basic calculations (continued): drag force
As stipulated in § 4.2, the drag force,
 $F_{{drag}}$
, is required for further analysis. The present section, dedicated to
$F_{{drag}}$
, is required for further analysis. The present section, dedicated to
 $F_{{drag}}$
, is organised as a continuation of § 3 and mirrors the same style as far as notations, non-dimensionalisation and scales are concerned. The scales relevant here are summarised in table 2 (which is the counterpart of table 1 there), where
$F_{{drag}}$
, is organised as a continuation of § 3 and mirrors the same style as far as notations, non-dimensionalisation and scales are concerned. The scales relevant here are summarised in table 2 (which is the counterpart of table 1 there), where
 $U$
is the droplet (translation) velocity in the vertical direction (its only component here).
$U$
is the droplet (translation) velocity in the vertical direction (its only component here).
Table 2. Scales used to render the various quantities dimensionless in § 5. The square brackets denote the scale of the quantity inside.

As the primary need for such a consideration arose in the context of large
 $\delta$
(cf. § 4.2), a mere use of the (dimensionless) Stokes drag
$\delta$
(cf. § 4.2), a mere use of the (dimensionless) Stokes drag
 $F_{{drag}}=6\pi$
in an unbounded medium could be quite sufficient here (as well as in § 6), where the rigid-sphere prefactor
$F_{{drag}}=6\pi$
in an unbounded medium could be quite sufficient here (as well as in § 6), where the rigid-sphere prefactor
 $6\pi$
is used on account of the liquid dynamic viscosity being much larger than the vapour one. Nonetheless, for the sake of generality, we shall here proceed implying
$6\pi$
is used on account of the liquid dynamic viscosity being much larger than the vapour one. Nonetheless, for the sake of generality, we shall here proceed implying
 $\delta =O(1)$
, all the more so as it will be particularly relevant later on in the context of § 7. Thus, the goal is to compute
$\delta =O(1)$
, all the more so as it will be particularly relevant later on in the context of § 7. Thus, the goal is to compute
 $F_{{drag}}(\delta )$
.
$F_{{drag}}(\delta )$
.
For this purpose, we once again solve the dimensionless Stokes equations (3.9)–(3.10) with the boundary conditions (3.11)–(3.12) (although the dimensional scales are now different and given by table 2). However, the ‘evaporation’ boundary conditions (3.13) are now replaced with
 \begin{equation} \boldsymbol{v} = \textbf{e}_{z} \end{equation}
reflecting droplet translation along
 $z$
. Finally, the same expression as on the right-hand side of (3.14) is used to compute
$z$
. Finally, the same expression as on the right-hand side of (3.14) is used to compute
 $F_{{drag}}$
.
$F_{{drag}}$
.

Figure 7. Dimensionless drag force as a function of the relative droplet height
 $\delta$
. Numerical results (blue open circles) agree well with the classical approximation (5.2) (red line). Black dashed lines correspond to the asymptotic behaviours.
$\delta$
. Numerical results (blue open circles) agree well with the classical approximation (5.2) (red line). Black dashed lines correspond to the asymptotic behaviours.
The computation results are illustrated in figure 7 together with the following approximate expression (Guyon et al. Reference Guyon, Hulin and Petit2012):
 \begin{equation} F_{{drag}}({\delta}) = 6 \pi \left (1 + \frac {1}{\delta } \right ) .\end{equation}
While strictly valid in the limits
 $\delta \to 0$
and
$\delta \to 0$
and
 $\delta \to +\infty$
, the result (5.2) can be seen to deviate from the numerical results by up to 7
$\delta \to +\infty$
, the result (5.2) can be seen to deviate from the numerical results by up to 7
 $\%$
for intermediate values of
$\%$
for intermediate values of
 $\delta \sim 1$
. A more precise fit of the numerical data is proposed in Appendix B3. Nonetheless, we shall stick in the present study to a simpler and more elegant expression (5.2), as we earlier did with (3.8) and (3.15), which will be sufficient for our purposes.
$\delta \sim 1$
. A more precise fit of the numerical data is proposed in Appendix B3. Nonetheless, we shall stick in the present study to a simpler and more elegant expression (5.2), as we earlier did with (3.8) and (3.15), which will be sufficient for our purposes.
6. Levitation and take-off: (indispensable) dynamic approach for smaller droplets
We now turn to the case of smaller droplets (levitating higher), for which the quasi-steady approach followed through in § 4.1 breaks down. As pointed out in § 4.2, the drag force, depending on the droplet translation velocity as it soars higher while vapourising, becomes essential (although not the inertia force). Supplementing the quasi-steady force balance (4.1) with the drag force, we obtain
 \begin{equation} -6\pi \mu _v R \left (1+\frac {R}{h}\right ) \frac {\mathrm {d} h}{\mathrm {d} t} +3\pi \frac {\mu _v\lambda _v \Delta T}{\rho _v \mathcal {L}} \frac {R^2}{h^2}\, \frac {R+2 h}{R+h}=\frac {4\pi }{3}\rho _l g R^3 . \end{equation}
Here, the dimensionless expression (5.2) multiplied by the scale from table 2 has been used with
 $U= {\mathrm {d} h}/{\mathrm {d} t}$
. (Strictly speaking, the velocity of the centre of mass is rather given by
$U= {\mathrm {d} h}/{\mathrm {d} t}$
. (Strictly speaking, the velocity of the centre of mass is rather given by
 $ ({\mathrm {d} h}/{\mathrm {d} t})+ ({\mathrm {d} R}/{\mathrm {d} t})$
, but we shall disregard such nuances here.)
$ ({\mathrm {d} h}/{\mathrm {d} t})+ ({\mathrm {d} R}/{\mathrm {d} t})$
, but we shall disregard such nuances here.)
The natural distinguished scales are such that all terms in (6.1) and in (4.6) are of the same order of magnitude:
 \begin{eqnarray} [\tilde {R}]=\left (\frac {\rho _v}{\rho _l}\right )^{2/9}\ell _* ,\quad [\tilde {h}]=\left (\frac {\rho _v}{\rho _l}\right )^{-1/9}\ell _* ,\quad [\tilde {t}]=\left (\frac {\rho _v}{\rho _l}\right )^{4/9} \tau _* , \end{eqnarray}
 \begin{eqnarray} \tilde {R}=\frac {R}{[\tilde {R}]} ,\quad \tilde {h}=\frac {h}{[\tilde {h}]} ,\quad \tilde {t}=\frac {t}{[\tilde {t}]} ,\quad \epsilon \equiv \frac {[\tilde {R}]}{[\tilde {h}]}=\left (\frac {\rho _v}{\rho _l}\right )^{1/3} , \end{eqnarray}
and the dynamical system becomes
 \begin{equation} - \left (1+\epsilon \frac {\tilde {R}}{\tilde {h}}\right ) \frac {\mathrm {d} \tilde {h}}{\mathrm {d}\tilde {t}} +\frac {\tilde {R}}{\tilde {h}^2}\, \frac {\tilde {h}+\frac {1}{2}\epsilon \tilde {R}}{\tilde {h}+\epsilon \tilde {R}}=\frac {2}{9} \tilde {R}^2 , \end{equation}
 \begin{equation} \tilde {R}\,\frac {\mathrm {d} \tilde {R}}{\mathrm {d} \tilde {t}}=-1-\frac {1}{2} \ln \left (1+\epsilon \frac {\tilde {R}}{\tilde {h}}\right ) . \end{equation}
The distinction between the present scales (6.2) and the previously considered ones (4.3) and (4.7) is eventually owing to a small parameter given by the vapour-to-liquid density ratio
 $\rho _v/\rho _l\ll 1$
. We note that the scales
$\rho _v/\rho _l\ll 1$
. We note that the scales
 $[\tilde {R}]$
and
$[\tilde {R}]$
and
 $[\tilde {h}]$
are different here, and the typical relative height of the droplet levitation is now
$[\tilde {h}]$
are different here, and the typical relative height of the droplet levitation is now
 $\delta \sim (\rho _l/\rho _v)^{1/3}\gg 1$
. It is exactly at such values of
$\delta \sim (\rho _l/\rho _v)^{1/3}\gg 1$
. It is exactly at such values of
 $\delta$
that criterion (4.12) of the quasi-steady force balance breaks down, as expected, which confirms the coherence of the present dynamic approach. At the same time, criterion (3.20) of the quasi-steadiness of the temperature and velocity fields between the droplet and the substrate is still satisfied, as already discussed in § 4.2.
$\delta$
that criterion (4.12) of the quasi-steady force balance breaks down, as expected, which confirms the coherence of the present dynamic approach. At the same time, criterion (3.20) of the quasi-steadiness of the temperature and velocity fields between the droplet and the substrate is still satisfied, as already discussed in § 4.2.

Figure 8. (a) Phase portrait of the dynamical system for
 $\tilde {R}(\tilde t)$
and
$\tilde {R}(\tilde t)$
and
 $\tilde {h}(\tilde t)$
appropriate in the limit of a smaller droplet levitating higher (incorporating the drag force in the quasi-steady force balance) and in the scaling appropriate to that limit (tilded variables). Parameter values used:
$\tilde {h}(\tilde t)$
appropriate in the limit of a smaller droplet levitating higher (incorporating the drag force in the quasi-steady force balance) and in the scaling appropriate to that limit (tilded variables). Parameter values used:
 $\epsilon =0.076$
, corresponding to water droplet experiments by Celestini et al. (Reference Celestini, Frisch and Pomeau2012) at
$\epsilon =0.076$
, corresponding to water droplet experiments by Celestini et al. (Reference Celestini, Frisch and Pomeau2012) at
 $\Delta T=300\,^\circ \mathrm {C}$
(cf. Appendix A). The blue solid line shows the earlier obtained quasi-steady ‘master curve’, which coincides with the separatrix (black solid line, ‘dynamic master curve’) for larger
$\Delta T=300\,^\circ \mathrm {C}$
(cf. Appendix A). The blue solid line shows the earlier obtained quasi-steady ‘master curve’, which coincides with the separatrix (black solid line, ‘dynamic master curve’) for larger
 $\tilde {R}$
but diverges (
$\tilde {R}$
but diverges (
 $\tilde {h}\to +\infty$
) for smaller
$\tilde {h}\to +\infty$
) for smaller
 $\tilde {R}$
. (b) Comparison with the mentioned experiment using the quasi-steady and dynamic master curves.
$\tilde {R}$
. (b) Comparison with the mentioned experiment using the quasi-steady and dynamic master curves.
The phase portrait of the dynamical system (6.4)–(6.5) is represented in figure 8(a) (generated using the StreamPlot command in Mathematica). Notably, while a Leidenfrost droplet is theoretically expected to ascend indefinitely within the quasi-steady approach, the presence of the drag force results in a saturation of
 $\tilde {h}$
towards a finite take-off value. In other words, the Leidenfrost droplets always vanish (
$\tilde {h}$
towards a finite take-off value. In other words, the Leidenfrost droplets always vanish (
 $\tilde {R}\to 0$
) at a finite height. Physically, the drag force, represented by the first term on the left-hand side of (6.1), becomes so significant towards the end of life of the droplet that it blocks the soaring tendency dictated by the levitation force (the second term ibid). In principle, the droplet can end up at whatever height, depending on the initial conditions (figure 8
a). However, there is a distinguished value of the final levitation height valid for most of the droplets, at least for those starting off from a sufficiently large size. In such a case, the phase trajectory is seen to reach the separatrix fast (figure 8
a), along which the droplet evolution ensues until the droplet vanishes at the distinguished final height corresponding to the separatrix
$\tilde {R}\to 0$
) at a finite height. Physically, the drag force, represented by the first term on the left-hand side of (6.1), becomes so significant towards the end of life of the droplet that it blocks the soaring tendency dictated by the levitation force (the second term ibid). In principle, the droplet can end up at whatever height, depending on the initial conditions (figure 8
a). However, there is a distinguished value of the final levitation height valid for most of the droplets, at least for those starting off from a sufficiently large size. In such a case, the phase trajectory is seen to reach the separatrix fast (figure 8
a), along which the droplet evolution ensues until the droplet vanishes at the distinguished final height corresponding to the separatrix
 \begin{equation} \tilde {h}_{{fin}}=1.69 (1 - 0.35\, \epsilon ) , \end{equation}
which was computed numerically assuming a linear dependence on the small parameter
 $\epsilon$
. Using the scales (6.2) on account of (4.3), this can be rewritten in dimensional terms
$\epsilon$
. Using the scales (6.2) on account of (4.3), this can be rewritten in dimensional terms
 \begin{equation} h_{{fin}}=1.69 \left (\frac {\rho _l}{\rho _v}\right )^{1/9} \left (\frac {\mu _v\lambda _v \Delta T}{\rho _v \rho _l g \mathcal {L}}\right )^{1/3} \left (1 - 0.35\left (\frac {\rho _v}{\rho _l}\right )^{1/3} \right ) . \end{equation}
For instance, under the conditions of the experiments by Celestini et al. (Reference Celestini, Frisch and Pomeau2012) with water droplets (cf. Appendix A for the parameters), we obtain
 $\tilde {h}_{{fin}} = 1.64$
and
$\tilde {h}_{{fin}} = 1.64$
and
 $h_{{fin}}=110.36\,\unicode{x03BC} \mathrm {m}$
. The separatrix now becomes our new, dynamic ‘master curve’. It replaces the quasi-steady one, soaring to infinity (
$h_{{fin}}=110.36\,\unicode{x03BC} \mathrm {m}$
. The separatrix now becomes our new, dynamic ‘master curve’. It replaces the quasi-steady one, soaring to infinity (
 $\tilde {h}\to +\infty$
) as
$\tilde {h}\to +\infty$
) as
 $\tilde {R}\to 0$
and corresponding to
$\tilde {R}\to 0$
and corresponding to
 \begin{equation} \frac {1}{\tilde {h}^2}\, \frac {\tilde {h}+\frac {1}{2}\epsilon \tilde {R}}{\tilde {h}+\epsilon \tilde {R}}=\frac {2}{9} \tilde {R}\, \end{equation}
in terms of the tilded variables, which is also depicted in figure 8 (solid blue line) for comparison. The dynamic master curve is different for smaller droplets (
 $\tilde {R}\lesssim 3$
), whereas for larger droplets the quasi-steady result is recovered, as expected.
$\tilde {R}\lesssim 3$
), whereas for larger droplets the quasi-steady result is recovered, as expected.
Figure 8(b) undertakes a direct comparison with the experiments by Celestini et al. (Reference Celestini, Frisch and Pomeau2012) for water droplets at
 $\Delta T=300\;^\circ \mathrm {C}$
. We see that the dynamic model, considered in the present section, shows a noticeable improvement over the previously considered quasi-steady approach. The improvement is just manifest for smaller droplets (
$\Delta T=300\;^\circ \mathrm {C}$
. We see that the dynamic model, considered in the present section, shows a noticeable improvement over the previously considered quasi-steady approach. The improvement is just manifest for smaller droplets (
 $R\lesssim 15\,\unicode{x03BC} \mathrm {m}$
).
$R\lesssim 15\,\unicode{x03BC} \mathrm {m}$
).
7. Dynamic approach in general
The dynamic approach considered in § 6 came as indispensable and, in this sense, forced in the domain of smaller droplets, where the consideration of § 4 based on the quasi-steady force balance could no longer be valid. At the same time, this made it limited to that domain, where, in particular, only the drag force was essential while inertia could be disregarded. In the present section, we take up a full dynamic approach, which would presumably be valid in the entire range of droplet sizes considered in the present paper. In § 4, we considered just the (quasi-)equilibrium positions (heights) of the droplet. Here, we inquire what the droplet behaviour will be if initially out of that equilibrium.
Complementing the force balance (6.1) with inertia, we arrive at
 \begin{equation} \frac {4\pi }{3} \rho _l R^3 \frac {\mathrm {d}^2 h}{\mathrm {d} t^2} =-6\pi \mu _v R \left (1+\frac {R}{h}\right ) \frac {\mathrm {d} h}{\mathrm {d} t} +3\pi \frac {\mu _v\lambda _v \Delta T}{\rho _v \mathcal {L}} \frac {R^2}{h^2}\, \frac {R+2 h}{R+h}-\frac {4\pi }{3}\rho _l g R^3 . \end{equation}
Thus, we end up with a third-order system of ordinary differential equations given by (7.1) and (4.6). It can in principle be (numerically) solved starting from any initial condition
 $R=R_0$
,
$R=R_0$
,
 $h=h_0$
,
$h=h_0$
,
 ${\mathrm {d} h}/{\mathrm {d} t}=h'_0$
at
${\mathrm {d} h}/{\mathrm {d} t}=h'_0$
at
 $t=0$
to obtain
$t=0$
to obtain
 $R(t)$
and
$R(t)$
and
 $h(t)$
, where
$h(t)$
, where
 $R_0\gt 0$
,
$R_0\gt 0$
,
 $h_0\gt 0$
and
$h_0\gt 0$
and
 $h'_0$
are some initial values.
$h'_0$
are some initial values.

Figure 9. Leidenfrost water droplet trajectories in the plane
 $h$
versus
$h$
versus
 $R$
computed by means of the general dynamic approach (including drag and inertia) using the parameters of Celestini et al. (Reference Celestini, Frisch and Pomeau2012) (cf. Appendix A). Initial radius
$R$
computed by means of the general dynamic approach (including drag and inertia) using the parameters of Celestini et al. (Reference Celestini, Frisch and Pomeau2012) (cf. Appendix A). Initial radius
 $R_0=30\,\unicode{x03BC}$
m. Various initial heights
$R_0=30\,\unicode{x03BC}$
m. Various initial heights
 $h_0$
are tested in (a) and (b) for
$h_0$
are tested in (a) and (b) for
 $h'_0=0$
, which are here represented relative to the equilibrium quasi-steady height
$h'_0=0$
, which are here represented relative to the equilibrium quasi-steady height
 $h_{{QS}}=50.24\,\unicode{x03BC} \mathrm {m}$
. Mimicking spraying, the role of an initial downward velocity
$h_{{QS}}=50.24\,\unicode{x03BC} \mathrm {m}$
. Mimicking spraying, the role of an initial downward velocity
 $-h'_0$
comparable to or greater than the droplet fall velocity
$-h'_0$
comparable to or greater than the droplet fall velocity
 $2 \rho _l g R_0^2/(9\mu _v)\approx 0.1\,\mathrm {m\, s^-{^1}}$
is explored in (c) for
$2 \rho _l g R_0^2/(9\mu _v)\approx 0.1\,\mathrm {m\, s^-{^1}}$
is explored in (c) for
 $h_0=5 h_{{QS}}$
and in (d) for
$h_0=5 h_{{QS}}$
and in (d) for
 $h_0=75 h_{{QS}}$
. The quasi-steady and dynamic master curves (blue and red dashed lines) are also shown for reference.
$h_0=75 h_{{QS}}$
. The quasi-steady and dynamic master curves (blue and red dashed lines) are also shown for reference.
The solution is illustrated in figure 9 for a water Leidenfrost droplet of an initial radius
 $R_0=30\,\unicode{x03BC}$
m starting from various initial heights
$R_0=30\,\unicode{x03BC}$
m starting from various initial heights
 $h_0$
and velocities
$h_0$
and velocities
 $h'_0$
. As earlier, the parameters of the experiment by Celestini et al. (Reference Celestini, Frisch and Pomeau2012) are used (i.e.
$h'_0$
. As earlier, the parameters of the experiment by Celestini et al. (Reference Celestini, Frisch and Pomeau2012) are used (i.e.
 $\Delta T=300\;^{\circ }$
C and 1 atm, cf. Appendix A). We note that the chosen value of the initial radius is large enough for the quasi-steady approach to work well (cf. Figure 8
b) and the corresponding quasi-steady height, obtained from (4.1) at
$\Delta T=300\;^{\circ }$
C and 1 atm, cf. Appendix A). We note that the chosen value of the initial radius is large enough for the quasi-steady approach to work well (cf. Figure 8
b) and the corresponding quasi-steady height, obtained from (4.1) at
 $R=R_0$
, is
$R=R_0$
, is
 $h_{{QS}}=50.24\,\unicode{x03BC} \mathrm {m}$
. The several initial heights tested are then conveniently expressed in the units of
$h_{{QS}}=50.24\,\unicode{x03BC} \mathrm {m}$
. The several initial heights tested are then conveniently expressed in the units of
 $h_{{QS}}$
. The previously obtained quasi-steady (§ 4) and dynamic (§ 6) master curves are also shown in figure 9 for reference.
$h_{{QS}}$
. The previously obtained quasi-steady (§ 4) and dynamic (§ 6) master curves are also shown in figure 9 for reference.
For
 $h_0=h_{{QS}}$
with
$h_0=h_{{QS}}$
with
 $h'_0=0$
, we see that the solution adheres to the dynamic master curve, which coincides with the quasi-steady one for larger
$h'_0=0$
, we see that the solution adheres to the dynamic master curve, which coincides with the quasi-steady one for larger
 $R$
and is drag-force-moderated for smaller
$R$
and is drag-force-moderated for smaller
 $R$
, and where the incorporation of inertia into the force balance has practically no effect, as expected. For an initial height
$R$
, and where the incorporation of inertia into the force balance has practically no effect, as expected. For an initial height
 $h_0$
out of the position
$h_0$
out of the position
 $h_{{QS}}$
(still with
$h_{{QS}}$
(still with
 $h'_0=0$
), the droplet approaches the dynamic master curve relatively fast in an oscillatory way (like a damped oscillator), and then the evolution continues along that curve. The droplets initially located too close to the substrate can rebound to considerable heights as propelled by the levitation force. The droplets starting from or propelled to considerable heights rejoin the dynamic master curve at a later time and smaller size. In this case, the rejoining already happens in a monotonic way, quite in accordance with the scenario for smaller droplets described in § 6, where inertia could be disregarded. Furthermore, the droplets finding themselves at a certain moment excessively high vapourise at some finite height before reaching the dynamic master curve, which also forms part of that scenario. Under the conditions explored in figure 9(a,b), the latter scenario occurs whenever
$h'_0=0$
), the droplet approaches the dynamic master curve relatively fast in an oscillatory way (like a damped oscillator), and then the evolution continues along that curve. The droplets initially located too close to the substrate can rebound to considerable heights as propelled by the levitation force. The droplets starting from or propelled to considerable heights rejoin the dynamic master curve at a later time and smaller size. In this case, the rejoining already happens in a monotonic way, quite in accordance with the scenario for smaller droplets described in § 6, where inertia could be disregarded. Furthermore, the droplets finding themselves at a certain moment excessively high vapourise at some finite height before reaching the dynamic master curve, which also forms part of that scenario. Under the conditions explored in figure 9(a,b), the latter scenario occurs whenever
 $h_0\lesssim (1/300)h_{{QS}}(R_0)=0.18\,\unicode{x03BC} \mathrm {m}$
and
$h_0\lesssim (1/300)h_{{QS}}(R_0)=0.18\,\unicode{x03BC} \mathrm {m}$
and
 $h_0\gtrsim 72 h_{{QS}}(R_0)=3.83\,\mathrm {mm}$
.
$h_0\gtrsim 72 h_{{QS}}(R_0)=3.83\,\mathrm {mm}$
.
Exploring considerable initial downward velocities can be relevant in the context of spraying. This is accomplished in figure 9(c,d) for two values of the initial height (
 $h_0=5 h_{{QS}}$
and
$h_0=5 h_{{QS}}$
and
 $h_0=75 h_{{QS}}$
). For
$h_0=75 h_{{QS}}$
). For
 $h_0=5 h_{{QS}}$
, finite positive values of
$h_0=5 h_{{QS}}$
, finite positive values of
 $-h'_0$
delay stabilisation at the master curve. Furthermore, if the initial downward velocity is sufficiently large, the droplet rebounds so high that it eventually vapourises before reaching the master curve. In contrast, from a much larger initial height
$-h'_0$
delay stabilisation at the master curve. Furthermore, if the initial downward velocity is sufficiently large, the droplet rebounds so high that it eventually vapourises before reaching the master curve. In contrast, from a much larger initial height
 $h_0=75 h_{{QS}}$
when the droplet vapourises before reaching the master curve with
$h_0=75 h_{{QS}}$
when the droplet vapourises before reaching the master curve with
 $h'_0=0$
, a finite initial downward velocity can help propel the droplet to its stabilisation at the master curve. Once again, this is unless the velocity is excessively large so that the droplet rebounds too high.
$h'_0=0$
, a finite initial downward velocity can help propel the droplet to its stabilisation at the master curve. Once again, this is unless the velocity is excessively large so that the droplet rebounds too high.
Small rebounds around the master curve can actually reproduce certain oscillatory trends observed in the experimental points by Celestini et al. (Reference Celestini, Frisch and Pomeau2012), as illustrated in figure 10. However, the nature of the experimental points located too close to the substrate remains unclear, the understanding of which may require staging further experiments and thinking of physical factors not included in the present model. The present modelling indicates that there may be a certain dependence on the manner in which the Leidenfrost droplets are deposited in experiment as the initial conditions can be such that the droplet fully evaporates before reaching the master curve.

Figure 10. Relative height
 $\delta =h/R$
of a water Leidenfrost droplet as a function of its radius
$\delta =h/R$
of a water Leidenfrost droplet as a function of its radius
 $R$
. The experimental data from Celestini et al. (Reference Celestini, Frisch and Pomeau2012) are compared with the quasi-steady and dynamic (drag-moderated) master curves, as well as with the trajectories computed from the general dynamic approach (including both drag and inertia) using the initial conditions
$R$
. The experimental data from Celestini et al. (Reference Celestini, Frisch and Pomeau2012) are compared with the quasi-steady and dynamic (drag-moderated) master curves, as well as with the trajectories computed from the general dynamic approach (including both drag and inertia) using the initial conditions
 $h_0/h_{{QS}}(R_0)=3/2$
,
$h_0/h_{{QS}}(R_0)=3/2$
,
 $R_0=\{20.8; \ 23.8; \ 28.8\}\,\unicode{x03BC}$
m and
$R_0=\{20.8; \ 23.8; \ 28.8\}\,\unicode{x03BC}$
m and
 $h'_0=0$
.
$h'_0=0$
.
The consistency of the approach in regard of the oscillatory relaxation obtained here can be assessed as follows. Focusing just on larger droplets with
 $h\sim R$
, the oscillation time scale
$h\sim R$
, the oscillation time scale
 $\tau _{{oscil}}=\sqrt {R/g}$
can be compared with the viscous and thermal time scales
$\tau _{{oscil}}=\sqrt {R/g}$
can be compared with the viscous and thermal time scales
 $\tau _{{vis}}\sim \rho _v R^2/\mu _v$
and
$\tau _{{vis}}\sim \rho _v R^2/\mu _v$
and
 $\tau _{{th}}\sim R^2/\alpha _v$
(the latter two are of the same order on account of
$\tau _{{th}}\sim R^2/\alpha _v$
(the latter two are of the same order on account of
 $\textit{Pr}\sim 1$
and can thus be used interchangeably in estimations). As
$\textit{Pr}\sim 1$
and can thus be used interchangeably in estimations). As
 $\tau _{{vis}}\tau _{{th}}/\tau _{{oscil}}^2={\textit{Gr}}$
, cf. (3.17), while it was estimated
$\tau _{{vis}}\tau _{{th}}/\tau _{{oscil}}^2={\textit{Gr}}$
, cf. (3.17), while it was estimated
 ${\textit{Gr}}\ll 1$
in § 3.5, we see that
${\textit{Gr}}\ll 1$
in § 3.5, we see that
 $\tau _{{vis}} ,\,\tau _{{th}}\ll \tau _{{oscil}}$
. Thus, the implied quasi-steadiness of the temperature and velocity fields does hold during the oscillation cycle, hence the sought consistency. Similarly, the ratio of the inertia and drag forces in (7.1) can be estimated at
$\tau _{{vis}} ,\,\tau _{{th}}\ll \tau _{{oscil}}$
. Thus, the implied quasi-steadiness of the temperature and velocity fields does hold during the oscillation cycle, hence the sought consistency. Similarly, the ratio of the inertia and drag forces in (7.1) can be estimated at
 $\sim ({\rho _l}/{\rho _v}){\textit{Gr}}^{1/2}$
taking
$\sim ({\rho _l}/{\rho _v}){\textit{Gr}}^{1/2}$
taking
 $\tau _{{oscil}}$
as the time scale. Even if
$\tau _{{oscil}}$
as the time scale. Even if
 ${\textit{Gr}}\ll 1$
, this can be superseded by
${\textit{Gr}}\ll 1$
, this can be superseded by
 $ ({\rho _l}/{\rho _v})\gg 1$
for larger droplets so that inertia dominates, hence the observed oscillatory relaxation. For smaller droplets, however, as
$ ({\rho _l}/{\rho _v})\gg 1$
for larger droplets so that inertia dominates, hence the observed oscillatory relaxation. For smaller droplets, however, as
 $\textit{Gr}$
decreases drastically with
$\textit{Gr}$
decreases drastically with
 $R$
, it is the drag that comes to dominate, hence a monotonic relaxation and the scenario of § 6.
$R$
, it is the drag that comes to dominate, hence a monotonic relaxation and the scenario of § 6.
8. Link to a more global picture
The larger the droplet is, the narrower the gap between the spherical droplet and the substrate becomes, as put into evidence by (4.4). As mentioned at the end of § 4.2, a key limitation to the present analysis from the side of larger droplets is expected to be caused by a deviation from sphericity within such a narrow gap, even if the droplet as a whole might still remain largely spherical. As this region is crucial for vapour generation and heat transfer, in spite of its smallness, any morphological change therein can have a significant impact on the Leidenfrost phenomenon. On the other hand, it is through such a morphological change at the bottom of the droplet that a transition from the small spherical to larger non-spherical Leidenfrost droplets is bridged, which is touched upon in the present section.
As established by Pomeau et al. (Reference Pomeau, Le Berre, Celestini and Frisch2012), cf. their (26), a significant deviation from sphericity at the bottom of the droplet in the aforementioned sense occurs for
 $R$
starting from
$R$
starting from
 $R\sim \ell _i$
, where the length scale
$R\sim \ell _i$
, where the length scale
 $\ell _i$
is given by
$\ell _i$
is given by
 \begin{equation} \ell _i=\left(\ell _*^3 \ell _c^4\right)^{1/7} \end{equation}
(all rewritten in our present notations). For
 $R\ll \ell _i$
, the droplet can be considered fully spherical (even at the bottom) and the analysis of the present paper holds. As
$R\ll \ell _i$
, the droplet can be considered fully spherical (even at the bottom) and the analysis of the present paper holds. As
 $\ell _*\ll \ell _c$
, (8.1) implies that
$\ell _*\ll \ell _c$
, (8.1) implies that
 $\ell _*\ll \ell _i\ll \ell _c$
. For our reference case of a water droplet on a superheated substrate with
$\ell _*\ll \ell _i\ll \ell _c$
. For our reference case of a water droplet on a superheated substrate with
 $\Delta T=300\;^{\circ }$
C (Celestini et al. Reference Celestini, Frisch and Pomeau2012, cf. Appendix A), we obtain
$\Delta T=300\;^{\circ }$
C (Celestini et al. Reference Celestini, Frisch and Pomeau2012, cf. Appendix A), we obtain
 $\ell _i=367\,\unicode{x03BC} \mathrm {m}$
.
$\ell _i=367\,\unicode{x03BC} \mathrm {m}$
.

Figure 11. Vapour film thickness
 $h$
under a water Leidenfrost droplet as a function of its radius
$h$
under a water Leidenfrost droplet as a function of its radius
 $R$
. Theoretical predictions reproduced from Sobac et al. (Reference Sobac, Rednikov, Dorbolo and Colinet2014, Reference Sobac, Rednikov, Dorbolo and Colinet2021) for large deformed droplets (
$R$
. Theoretical predictions reproduced from Sobac et al. (Reference Sobac, Rednikov, Dorbolo and Colinet2014, Reference Sobac, Rednikov, Dorbolo and Colinet2021) for large deformed droplets (
 $R \gtrsim \ell _i$
), and by the present model for small spherical droplets (
$R \gtrsim \ell _i$
), and by the present model for small spherical droplets (
 $R\ll \ell _i$
) are compared with experimental data from Burton et al. (Reference Burton, Sharpe, van der Veen, Franco and Nagel2012) and Celestini et al. (Reference Celestini, Frisch and Pomeau2012), respectively. Unlike the previous examples, the computations are here done with
$R\ll \ell _i$
) are compared with experimental data from Burton et al. (Reference Burton, Sharpe, van der Veen, Franco and Nagel2012) and Celestini et al. (Reference Celestini, Frisch and Pomeau2012), respectively. Unlike the previous examples, the computations are here done with
 $\Delta T=270\;^{\circ }$
C to follow Burton et al. (Reference Burton, Sharpe, van der Veen, Franco and Nagel2012) (cf. also Appendix A), whereas the data by Celestini et al. (Reference Celestini, Frisch and Pomeau2012) still correspond to
$\Delta T=270\;^{\circ }$
C to follow Burton et al. (Reference Burton, Sharpe, van der Veen, Franco and Nagel2012) (cf. also Appendix A), whereas the data by Celestini et al. (Reference Celestini, Frisch and Pomeau2012) still correspond to
 $\Delta T=300\;^{\circ }$
C (hence a slight misplacement relative to the theoretical curve as compared with previous figures). For large droplets, the
$\Delta T=300\;^{\circ }$
C (hence a slight misplacement relative to the theoretical curve as compared with previous figures). For large droplets, the
 $h$
curve splits into two branches
$h$
curve splits into two branches
 $h_{{neck}}$
and
$h_{{neck}}$
and
 $h_{{centre}}$
at the point where the vapour layer between the droplet and the substrate adopts a ‘pocket-like’ structure edged by a narrow annular neck, such that the minimum thickness no longer corresponds to the centre and switches to the neck.
$h_{{centre}}$
at the point where the vapour layer between the droplet and the substrate adopts a ‘pocket-like’ structure edged by a narrow annular neck, such that the minimum thickness no longer corresponds to the centre and switches to the neck.
Figure 11 illustrates the Leidenfrost effect at large, over four decades of the droplet size. It combines the present results for the (small) spherical Leidenfrost droplets to the left of the figure (the dynamic master curve) with the results for the usual (large and deformed) droplets reproduced from Sobac et al. (Reference Sobac, Rednikov, Dorbolo and Colinet2014, Reference Sobac, Rednikov, Dorbolo and Colinet2021) to the right. We note that for the non-spherical droplets the radius
 $R$
is here defined as the radius of the vertical projection on the substrate (i.e. as the maximum horizontal radius). Two sets of experimental results, corresponding to the two drastically different size domains, are plotted alongside the theoretical curves: the ones by Celestini et al. (Reference Celestini, Frisch and Pomeau2012) and by Burton et al. (Reference Burton, Sharpe, van der Veen, Franco and Nagel2012). The overlapping occurs at
$R$
is here defined as the radius of the vertical projection on the substrate (i.e. as the maximum horizontal radius). Two sets of experimental results, corresponding to the two drastically different size domains, are plotted alongside the theoretical curves: the ones by Celestini et al. (Reference Celestini, Frisch and Pomeau2012) and by Burton et al. (Reference Burton, Sharpe, van der Veen, Franco and Nagel2012). The overlapping occurs at
 $R\sim \ell _i$
, quite as expected. Nevertheless, it does not appear to happen smoothly, which is most definitely due to some accuracy loss towards the limit of small near-spherical droplets within the model employed by Sobac et al. (Reference Sobac, Rednikov, Dorbolo and Colinet2014, Reference Sobac, Rednikov, Dorbolo and Colinet2021). Notably, it is in this intermediate (overlapping) region that an absolute minimum of the vapour layer thicknesses is attained: from there,
$R\sim \ell _i$
, quite as expected. Nevertheless, it does not appear to happen smoothly, which is most definitely due to some accuracy loss towards the limit of small near-spherical droplets within the model employed by Sobac et al. (Reference Sobac, Rednikov, Dorbolo and Colinet2014, Reference Sobac, Rednikov, Dorbolo and Colinet2021). Notably, it is in this intermediate (overlapping) region that an absolute minimum of the vapour layer thicknesses is attained: from there,
 $h$
increases both towards the small spherical droplets as a take-off precursor and towards the large deformed droplets.
$h$
increases both towards the small spherical droplets as a take-off precursor and towards the large deformed droplets.
9. Conclusions
The dynamics of small spherical Leidenfrost droplets has been investigated theoretically, yielding valuable new insights into their final stages of existence.
After numerically calculating the fluxes, evaporation rate and forces for a spherical Leidenfrost droplet interacting with a superheated flat substrate (under the verifiable assumptions of quasi-stationarity and low Reynolds and Péclet numbers) and coming up with simple formulae approximating these data as a function of the reduced height
 $\delta =h/R$
(all respecting the asymptotic behaviours as
$\delta =h/R$
(all respecting the asymptotic behaviours as
 $\delta \to 0$
and
$\delta \to 0$
and
 $\delta \to +\infty$
, also studied here), a theoretical model has been developed which allows an accurate prediction of the droplet height
$\delta \to +\infty$
, also studied here), a theoretical model has been developed which allows an accurate prediction of the droplet height
 $h$
as a function of the physical parameters without any fitting parameters.
$h$
as a function of the physical parameters without any fitting parameters.
First, by balancing the droplet’s weight against the upward hydrodynamic force induced by evaporation, a ‘quasi-steady master curve’ relating droplet height
 $h$
to droplet radius
$h$
to droplet radius
 $R$
was derived. This curve follow the
$R$
was derived. This curve follow the
 $h\propto R^{-1/2}$
scaling law formulated by Celestini et al. (Reference Celestini, Frisch and Pomeau2012) and Pomeau et al. (Reference Pomeau, Le Berre, Celestini and Frisch2012). However, the prefactor is not constant and rather varies from
$h\propto R^{-1/2}$
scaling law formulated by Celestini et al. (Reference Celestini, Frisch and Pomeau2012) and Pomeau et al. (Reference Pomeau, Le Berre, Celestini and Frisch2012). However, the prefactor is not constant and rather varies from
 $3/2$
when
$3/2$
when
 $R\to +\infty$
to
$R\to +\infty$
to
 $3/\sqrt {2}$
as
$3/\sqrt {2}$
as
 $R \to 0$
.
$R \to 0$
.
Furthermore, our analysis reveals that the aforementioned classical quasi-steady description, while capturing the general trend of the ‘take-off’ phenomenon, is unable to accurately reproduce the experimental data of Celestini et al. (Reference Celestini, Frisch and Pomeau2012). Dynamic effects, especially those related to frictional forces, are crucial to accurately describe the take-off at small scales. Therefore, a ‘dynamic master curve’, drag-moderated, has been also derived and well reproduces the experimental data of Celestini et al. (Reference Celestini, Frisch and Pomeau2012). As a consequence of the friction effect, the Leidenfrost droplets disappear at a finite height, the value of which turns out to be universal for sufficiently large initial droplets. This is in contrast to the prediction of the quasi-stationary model, which suggests an infinite final height. A formula that predicts this universal final height has been established.
In addition, a general dynamic model including both drag and inertia effects has been used to investigate the influence of initial conditions on droplet dynamics. For an initial height
 $h_0$
out of the equilibrium position
$h_0$
out of the equilibrium position
 $h_{{QS}}$
, a sufficiently large droplet approaches the ‘dynamic master curve’ relatively quickly and in an oscillatory manner (like a damped oscillator), and then continues to evolve along this curve. Such small rebounds can indeed reproduce certain oscillatory trends observed in the experimental points of Celestini et al. (Reference Celestini, Frisch and Pomeau2012). This scenario holds for initial conditions not too far from equilibrium; otherwise, the droplets that find themselves too high at a given moment evaporate at a finite height before reaching the dynamic master curve. However, even for droplets initially situated that high, an appreciable initial downward velocity (e.g. due to spraying) can help them reach the master curve. All this highlights a certain dependence of the Leidenfrost droplet deposition manner on the result.
$h_{{QS}}$
, a sufficiently large droplet approaches the ‘dynamic master curve’ relatively quickly and in an oscillatory manner (like a damped oscillator), and then continues to evolve along this curve. Such small rebounds can indeed reproduce certain oscillatory trends observed in the experimental points of Celestini et al. (Reference Celestini, Frisch and Pomeau2012). This scenario holds for initial conditions not too far from equilibrium; otherwise, the droplets that find themselves too high at a given moment evaporate at a finite height before reaching the dynamic master curve. However, even for droplets initially situated that high, an appreciable initial downward velocity (e.g. due to spraying) can help them reach the master curve. All this highlights a certain dependence of the Leidenfrost droplet deposition manner on the result.
Combining the present model (valid when
 $R\lt \ell _i$
) with the one of Sobac et al. (Reference Sobac, Rednikov, Dorbolo and Colinet2014, Reference Sobac, Rednikov, Dorbolo and Colinet2021) for larger deformed droplets (valid when
$R\lt \ell _i$
) with the one of Sobac et al. (Reference Sobac, Rednikov, Dorbolo and Colinet2014, Reference Sobac, Rednikov, Dorbolo and Colinet2021) for larger deformed droplets (valid when
 $R\gt \ell _i$
), we offer a comprehensive picture of the shape and elevation of Leidenfrost droplets across a the full range of stable axisymmetric shapes, spanning four decades of droplet sizes. These studies also align with the hierarchy of length scales
$R\gt \ell _i$
), we offer a comprehensive picture of the shape and elevation of Leidenfrost droplets across a the full range of stable axisymmetric shapes, spanning four decades of droplet sizes. These studies also align with the hierarchy of length scales
 $\ell _{*}\lt \ell _i\lt \ell _c$
pointed out by Pomeau et al. (Reference Pomeau, Le Berre, Celestini and Frisch2012), emphasising the dominant physical mechanisms and associated scalings.
$\ell _{*}\lt \ell _i\lt \ell _c$
pointed out by Pomeau et al. (Reference Pomeau, Le Berre, Celestini and Frisch2012), emphasising the dominant physical mechanisms and associated scalings.
We hope this research will stimulate further theoretical investigations, particularly in the intermediate region (
 $R\approx \ell _i$
) where the vapour layer is thinnest, and encourage further experimental studies on Leidenfrost droplets with
$R\approx \ell _i$
) where the vapour layer is thinnest, and encourage further experimental studies on Leidenfrost droplets with
 $R\lesssim \ell _i$
, an area that remains underexplored.
$R\lesssim \ell _i$
, an area that remains underexplored.
Funding
B.S. gratefully acknowledges the support from Centre National de la Recherche Scientifique – CNRS, A.R. from BELSPO and ESA PRODEX Evaporation, and P.C. from the Fonds de la Recherche Scientifique – FNRS.
Declaration of interests
The authors report no conflict of interest.
Appendix A. Properties
The properties used in this work are provided in table 3 (Sobac et al. Reference Sobac, Talbot, Haut, Rednikov and Colinet2015, Reference Sobac, Rednikov, Dorbolo and Colinet2017).
To facilitate continuity with some previous studies of the usual (larger non-spherical) Leidenfrost droplets (Sobac et al. Reference Sobac, Rednikov, Dorbolo and Colinet2014, Reference Sobac, Rednikov, Dorbolo and Colinet2021; Chantelot & Lohse Reference Chantelot and Lohse2021), apart from the parameters defined in the main text, we here also follow the (dimensionless) evaporation number
 \begin{equation} {\mathcal {E}}= \frac {\mu _v \lambda _v \Delta T}{\gamma {\mathcal {L}} \rho _v \ell _c} . \end{equation}
We note the formula
 $\ell _*={\mathcal {E}}^{1/3} \ell _c$
and
$\ell _*={\mathcal {E}}^{1/3} \ell _c$
and
 $\ell _i={\mathcal {E}}^{1/7} \ell _c$
resulting from (4.3), (8.1) and (A1).
$\ell _i={\mathcal {E}}^{1/7} \ell _c$
resulting from (4.3), (8.1) and (A1).
Table 3. Parameter values at
 $1\,\mathrm {atm}$
(where relevant). Liquid density
$1\,\mathrm {atm}$
(where relevant). Liquid density
 $\rho _l$
, latent heat
$\rho _l$
, latent heat
 $\mathcal {L}$
, surface tension
$\mathcal {L}$
, surface tension
 $\gamma$
and capillary length
$\gamma$
and capillary length
 $\ell _c=\sqrt {\gamma /\rho _l g}$
(
$\ell _c=\sqrt {\gamma /\rho _l g}$
(
 $g$
gravitational acceleration) at the boiling temperature
$g$
gravitational acceleration) at the boiling temperature
 $T_{{sat}}$
; superheat
$T_{{sat}}$
; superheat
 $\Delta T\equiv T_w-T_{{sat}}$
, with
$\Delta T\equiv T_w-T_{{sat}}$
, with
 $T_w$
the substrate temperature; vapour thermal conductivity
$T_w$
the substrate temperature; vapour thermal conductivity
 $\lambda _v$
, viscosity
$\lambda _v$
, viscosity
 $\mu _v$
, density
$\mu _v$
, density
 $\rho _v$
at the mid-temperature
$\rho _v$
at the mid-temperature
 $ {1}/{2}(T_{{sat}}+ T_w)$
; take-off scale
$ {1}/{2}(T_{{sat}}+ T_w)$
; take-off scale
 $\ell _*$
, cf. (4.3); non-sphericity scale
$\ell _*$
, cf. (4.3); non-sphericity scale
 $\ell _i$
, cf. (8.1);
$\ell _i$
, cf. (8.1);
 $\epsilon \equiv (\rho _v/\rho _l)^{1/3}$
; evaporation number
$\epsilon \equiv (\rho _v/\rho _l)^{1/3}$
; evaporation number
 $\mathcal {E}$
, cf. (A1). The first and third cases (rows) correspond to Celestini et al. (Reference Celestini, Frisch and Pomeau2012), while the second corresponds to Burton et al. (Reference Burton, Sharpe, van der Veen, Franco and Nagel2012) and the fourth corresponds to Lyu et al. (Reference Lyu, Mathai, Wang, Sobac, Colinet, Lohse and Sun2019).
$\mathcal {E}$
, cf. (A1). The first and third cases (rows) correspond to Celestini et al. (Reference Celestini, Frisch and Pomeau2012), while the second corresponds to Burton et al. (Reference Burton, Sharpe, van der Veen, Franco and Nagel2012) and the fourth corresponds to Lyu et al. (Reference Lyu, Mathai, Wang, Sobac, Colinet, Lohse and Sun2019).

Appendix B. Some more precise fits of numerical data
In addition to the simplified fits (approximations) outlined in the main text, more precise fits are proposed herein. These fits are presented alongside and compared with the numerically computed data in figure 12. The asymptotic behaviours derived in Appendix C are also depicted.

Figure 12. (a) Evaporation rate of and forces acting on a spherical Leidenfrost droplet as a function of its reduced height
 $\delta$
. Numerically computed data are presented alongside their asymptotic behaviours and compared with fits of two different levels of precision. (b) Corresponding ratio of the numerical data to the proposed fits as a function of
$\delta$
. Numerically computed data are presented alongside their asymptotic behaviours and compared with fits of two different levels of precision. (b) Corresponding ratio of the numerical data to the proposed fits as a function of
 $\delta$
.
$\delta$
.
B.1. Fit for
$J(\delta )$

The expression (3.8) can further be improved as follows:
 \begin{equation} J(\delta )= 4\pi \left [1+\frac{1}{2}\ln \left (1+\frac {1}{\delta }\right )- \left (1-\frac {1}{2}\ln 2-\gamma \right ) \frac {1}{1+50.8 \delta ^2} \right ] , \end{equation}
where
 $\gamma =0.577216$
is the Euler constant, while the coefficient 50.8 results from fitting to the numerically computed data. The expression (B1) respects the two-term asymptotic expansions both as
$\gamma =0.577216$
is the Euler constant, while the coefficient 50.8 results from fitting to the numerically computed data. The expression (B1) respects the two-term asymptotic expansions both as
 $\delta \to 0$
and as
$\delta \to 0$
and as
 $\delta \to +\infty$
obtained in Appendices C1 and C2, respectively.
$\delta \to +\infty$
obtained in Appendices C1 and C2, respectively.
B.2. Fit for
$F_{{ev}}(\delta )$

A more precise expression than (3.15) is given by
 \begin{equation} F_{{ev}}(\delta )= \frac {3 \pi }{\delta ^2} \left (1 + \frac {\delta }{0.924 + \delta } \right ) , \end{equation}
where the coefficient 0.924 is obtained by fitting to the numerically computed data. As earlier (3.15), the expression (B2) respects the leading-order asymptotic behaviour in the limits
 $\delta \to 0$
and
$\delta \to 0$
and
 $\delta \to +\infty$
considered in Appendices C3 and C4, respectively.
$\delta \to +\infty$
considered in Appendices C3 and C4, respectively.
B.3. Fit for
$F_{{drag}}(\delta )$

A better approximation than (5.2) is provided by the formula
 \begin{equation} F_{{drag}}(\delta )=6\pi \left (1+ \frac {1}{\delta }+1.161 \frac {1+26.01\delta }{1+62.447\delta +187.12\delta ^2+2.514 \delta ^3} \right ) , \end{equation}
where the coefficients in the last term result from fitting the expression to the numerically computed data. The leading-order asymptotic behaviour as
 $\delta \to 0$
and the two-term asymptotic expansion as
$\delta \to 0$
and the two-term asymptotic expansion as
 $\delta \to +\infty$
are for (B3) the same as for (5.2).
$\delta \to +\infty$
are for (B3) the same as for (5.2).
Appendix C. Asymptotic behaviours
C.1. Case of
$J$
as
$\delta \to 0$


We now consider the case when the sphere (dimensionless radius unity) is close to the substrate (
 $\delta \ll 1$
). Its profile
$\delta \ll 1$
). Its profile
 $z=h(r)$
(
$z=h(r)$
(
 $z=0$
at the substrate) in a small vicinity of the downmost point is well approximated by a parabola
$z=0$
at the substrate) in a small vicinity of the downmost point is well approximated by a parabola
 $h=\delta +({1}/{2}) r^2$
matching with the outer circular droplet shape. The evaporation flux is given by heat conduction across this thin vapour layer, viz.
$h=\delta +({1}/{2}) r^2$
matching with the outer circular droplet shape. The evaporation flux is given by heat conduction across this thin vapour layer, viz.
 $j=1/h$
in dimensionless form. Integrating over such a small vicinity up to a reference point
$j=1/h$
in dimensionless form. Integrating over such a small vicinity up to a reference point
 $r=r_1\ll 1$
, one obtains
$r=r_1\ll 1$
, one obtains
 $J_1=2\pi \int _0^{r_1}r\, j\,\textrm {d}r =2\pi \ln (\delta +({1}/{2}) r_1^2)-2\pi \ln \delta$
for the first contribution into the evaporation rate
$J_1=2\pi \int _0^{r_1}r\, j\,\textrm {d}r =2\pi \ln (\delta +({1}/{2}) r_1^2)-2\pi \ln \delta$
for the first contribution into the evaporation rate
 $J$
. One can observe a logarithmic divergence and assume the sought asymptotic behaviour in the form
$J$
. One can observe a logarithmic divergence and assume the sought asymptotic behaviour in the form
 $J\sim 2\pi (-\ln \delta +\mathrm {const})$
as
$J\sim 2\pi (-\ln \delta +\mathrm {const})$
as
 $\delta \to 0$
. However, to fully determine
$\delta \to 0$
. However, to fully determine
 $\mathrm {const}$
, one needs to consider the contribution
$\mathrm {const}$
, one needs to consider the contribution
 $J_2$
from the rest of the sphere, such that eventually
$J_2$
from the rest of the sphere, such that eventually
 $J=J_1+J_2$
. For this purpose, it suffices to solve the problem (3.2)–(3.5) for a unit sphere lying on the substrate (with formally
$J=J_1+J_2$
. For this purpose, it suffices to solve the problem (3.2)–(3.5) for a unit sphere lying on the substrate (with formally
 $\delta =0$
). This can be done numerically with
$\delta =0$
). This can be done numerically with
 $J_2$
determined by integrating (3.6) over the rest of the sphere up to the point
$J_2$
determined by integrating (3.6) over the rest of the sphere up to the point
 $r=r_1$
on the lower surface. The result diverges in the limit
$r=r_1$
on the lower surface. The result diverges in the limit
 $r_1\to 0$
: as
$r_1\to 0$
: as
 $J_2=-4\pi \ln r_1+\mathrm {const}_1$
, where
$J_2=-4\pi \ln r_1+\mathrm {const}_1$
, where
 $\mathrm {const}_1$
is determined numerically by choosing sufficiently small
$\mathrm {const}_1$
is determined numerically by choosing sufficiently small
 $r_1$
. In this way, we finally arrive at
$r_1$
. In this way, we finally arrive at
 $J\sim 2\pi (-\ln \delta +1.85)$
as
$J\sim 2\pi (-\ln \delta +1.85)$
as
 $\delta \to 0$
(the terms with
$\delta \to 0$
(the terms with
 $r_1$
cancelling out in
$r_1$
cancelling out in
 $J_1+J_2$
). Within the computation precision and with
$J_1+J_2$
). Within the computation precision and with
 $\gamma$
being the Euler constant, this can be rewritten as
$\gamma$
being the Euler constant, this can be rewritten as
 $J\sim 2\pi (-\ln \delta +\ln 2+2\gamma )$
as
$J\sim 2\pi (-\ln \delta +\ln 2+2\gamma )$
as
 $\delta \to 0$
, which is taken into account when constructing the fit (B1). This (exact) value of the constant can in principle be obtained from the exact solution of the present heat conduction problem in curvilinear coordinates (similarly to e.g. Lebedev Reference Lebedev1972; Popov Reference Popov2005), although we here limit ourselves to corresponding numerical solutions. The approximation (3.8) respects exactly the logarithmic divergence, but just approximately the constant.
$\delta \to 0$
, which is taken into account when constructing the fit (B1). This (exact) value of the constant can in principle be obtained from the exact solution of the present heat conduction problem in curvilinear coordinates (similarly to e.g. Lebedev Reference Lebedev1972; Popov Reference Popov2005), although we here limit ourselves to corresponding numerical solutions. The approximation (3.8) respects exactly the logarithmic divergence, but just approximately the constant.
C.2. Case of
$J$
as
$\delta \to +\infty$


When the sphere is far away from the substrate, the leading-order result is as for the sphere in an unbounded medium
 \begin{equation} T=1-1/r_{{sph}} , \end{equation}
where
 $r_{{sph}}=\sqrt {r^2+(z-\delta -1)^2}$
is the spherical radial coordinate from the centre of the sphere (the difference with the cylindrical radial coordinate
$r_{{sph}}=\sqrt {r^2+(z-\delta -1)^2}$
is the spherical radial coordinate from the centre of the sphere (the difference with the cylindrical radial coordinate
 $r$
is marked by the subscript). Therefore,
$r$
is marked by the subscript). Therefore,
 $j=\partial _{r_{{sph}}}T|_{r_{{sph}}=1}=1$
and hence
$j=\partial _{r_{{sph}}}T|_{r_{{sph}}=1}=1$
and hence
 $J=4\pi$
. The first correction comes from the sphere reflection in the substrate. The image sphere adds the following primary contribution into the temperature field in the original domain (above the substrate,
$J=4\pi$
. The first correction comes from the sphere reflection in the substrate. The image sphere adds the following primary contribution into the temperature field in the original domain (above the substrate,
 $z\gt 0$
)
$z\gt 0$
)
 \begin{equation} T_{{im}}=1/r_{{sph,im}} , \end{equation}
where
 $r_{{sph,im}}=\sqrt {r^2+(z+\delta +1)^2}$
and the (additional) subscript ‘im’ is associated with the image. The primary effect of (C2) is to increase the local ambient temperature around the original sphere from
$r_{{sph,im}}=\sqrt {r^2+(z+\delta +1)^2}$
and the (additional) subscript ‘im’ is associated with the image. The primary effect of (C2) is to increase the local ambient temperature around the original sphere from
 $T=1$
to
$T=1$
to
 $T=1+1/(2\delta )$
. As
$T=1+1/(2\delta )$
. As
 $T=0$
at the sphere surface, cf. (3.5), the values of
$T=0$
at the sphere surface, cf. (3.5), the values of
 $j$
and
$j$
and
 $J$
are then increased in the same proportion. Thus, we arrive at
$J$
are then increased in the same proportion. Thus, we arrive at
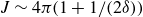 $J\sim 4\pi (1+1/(2\delta ))$
as
$J\sim 4\pi (1+1/(2\delta ))$
as
 $\delta \to +\infty$
, which is respected by both the fit (3.8) and (B1).
$\delta \to +\infty$
, which is respected by both the fit (3.8) and (B1).
C.3. Case of
$F_{{ev}}$
as
$\delta \to 0$


In dimensionless terms (scales provided in table 1), the lubrication equation in the thin vapour layer between the substrate and the sphere can be written as
 $({1}/{12)r^{-1}}\partial _r (r h^3 \partial _r P_v)+{1}/{h}=0$
(cf. also Sobac et al. Reference Sobac, Rednikov, Dorbolo and Colinet2021), where
$({1}/{12)r^{-1}}\partial _r (r h^3 \partial _r P_v)+{1}/{h}=0$
(cf. also Sobac et al. Reference Sobac, Rednikov, Dorbolo and Colinet2021), where
 $P_v$
is the vapour pressure excess over the ambient one (hence
$P_v$
is the vapour pressure excess over the ambient one (hence
 $P_v\to 0$
far away). Integrating with
$P_v\to 0$
far away). Integrating with
 $h=\delta + ({1}/{2}) r^2$
and on account of symmetry
$h=\delta + ({1}/{2}) r^2$
and on account of symmetry
 $\partial _r P_v|_{r=0}=0$
, one obtains
$\partial _r P_v|_{r=0}=0$
, one obtains
 $\partial _r P_v=-12 h^{-3} r^{-1} \ln ({h}/{\delta })$
. The leading-order contribution into
$\partial _r P_v=-12 h^{-3} r^{-1} \ln ({h}/{\delta })$
. The leading-order contribution into
 $F_{{ev}}$
is given by
$F_{{ev}}$
is given by
 $F_{{ev}}=2\pi \int _0^{+\infty } r P_v \textrm {d}r=\pi r^2 P_v|_{r\to +\infty }-\pi \int _0^{+\infty } r^2 \partial _r P_v \textrm {d}r=3\pi /\delta ^2$
, which is the sought behaviour as
$F_{{ev}}=2\pi \int _0^{+\infty } r P_v \textrm {d}r=\pi r^2 P_v|_{r\to +\infty }-\pi \int _0^{+\infty } r^2 \partial _r P_v \textrm {d}r=3\pi /\delta ^2$
, which is the sought behaviour as
 $\delta \to 0$
and is respected in (B2).
$\delta \to 0$
and is respected in (B2).
C.4. Case of
$F_{{ev}}$
as
$\delta \to +\infty$


Assuming
 $\delta \gg 1$
, we shall distinguish three contributions into the sought asymptotic behaviour:
$\delta \gg 1$
, we shall distinguish three contributions into the sought asymptotic behaviour:
 $F_{{ev}}=F_{{ev1}}+F_{{ev2}}+F_{{ev3}}$
, which are all of the same order.
$F_{{ev}}=F_{{ev1}}+F_{{ev2}}+F_{{ev3}}$
, which are all of the same order.
First, the leading-order (spherically symmetric) flow field
 \begin{equation} {\boldsymbol {v}}=\frac {{\boldsymbol {r}}_{{sph}}}{r_{{sph}}^3} \end{equation}
from our evaporating sphere (
 ${\boldsymbol {r}}_{{sph}}$
being the position vector from the sphere’s centre) is supplemented by the one from the image sphere
${\boldsymbol {r}}_{{sph}}$
being the position vector from the sphere’s centre) is supplemented by the one from the image sphere
 \begin{equation} {\boldsymbol {v}}_{{im}}=\frac {{\boldsymbol {r}}_{{sph,im}}}{r_{{sph,im}}^3} \end{equation}
(in the original domain
 $z\gt 0$
). At the location of the original sphere (
$z\gt 0$
). At the location of the original sphere (
 $r=0$
,
$r=0$
,
 $z=\delta +1$
), in the limit
$z=\delta +1$
), in the limit
 $\delta \gg 1,$
the velocity field (C4) gives rise to a (quasi-)uniform streaming velocity
$\delta \gg 1,$
the velocity field (C4) gives rise to a (quasi-)uniform streaming velocity
 $v_0=1/(4(\delta +1)^2)\sim 1/(4\delta ^2)$
directed vertically upwards. This in turn gives rise to the Stokes drag
$v_0=1/(4(\delta +1)^2)\sim 1/(4\delta ^2)$
directed vertically upwards. This in turn gives rise to the Stokes drag
 $6\pi \mu _v R\, v_0$
upon the original sphere (in dimensional terms). In our present dimensionless terms (cf. table 1), this amounts to
$6\pi \mu _v R\, v_0$
upon the original sphere (in dimensional terms). In our present dimensionless terms (cf. table 1), this amounts to
 $F_{{ev1}}=6\pi v_0=3\pi /(2\delta ^2)$
.
$F_{{ev1}}=6\pi v_0=3\pi /(2\delta ^2)$
.
Second, the superposition of the velocity fields (C3) and (C4) does satisfy the impermeability condition at the substrate:
 $v_z=0$
at
$v_z=0$
at
 $z=0$
(hereafter
$z=0$
(hereafter
 $v_r$
and
$v_r$
and
 $v_z$
are the
$v_z$
are the
 $r$
- and
$r$
- and
 $z$
-components of the velocity field). However, the no-slip condition
$z$
-components of the velocity field). However, the no-slip condition
 $v_r=0$
at
$v_r=0$
at
 $z=0$
is not satisfied. To remedy this, we consider another contribution into the velocity field, the addition of which permits to observe the no-slip condition. We proceed in terms of the streamfunction
$z=0$
is not satisfied. To remedy this, we consider another contribution into the velocity field, the addition of which permits to observe the no-slip condition. We proceed in terms of the streamfunction
 $\psi$
 \begin{equation} v_r=\frac {1}{r} \partial _z \psi ,\quad v_z=-\frac {1}{r} \partial _r \psi . \end{equation}
The Stokes equation can be written as (cf. e.g. Happel & Brenner Reference Happel and Brenner1965)
 \begin{equation} E^2 E^2\psi =0 , \quad E^2= \partial _{rr}-\frac {1}{r} \partial _r + \partial _{zz} , \end{equation}
which is solved in the domain
 $z\gt 0$
with the boundary conditions
$z\gt 0$
with the boundary conditions
 \begin{equation} \psi =0 ,\ \partial _z\psi =-\frac {2 r^2}{[(\delta +1)^2+r^2]^{3/2}}\ \text {at}\ z=0 , \quad \psi /r_{{sph}}^2\to 0 \ \text {at infinity}. \end{equation}
The slip velocity in the second condition (C7) is directed towards the axis and is such as to offset the corresponding contribution from the sum of (C3) and (C4). One can verify that
 \begin{equation} \psi =-\frac {2 r^2 z}{[(\delta +1+z)^2+r^2]^{3/2}} \end{equation}
is an exact solution of the problem (C6), (C7). Eventually, we are just interested in the velocity field value
 $v_0$
at the location of the original sphere (
$v_0$
at the location of the original sphere (
 $r=0$
,
$r=0$
,
 $z=\delta +1$
). Using (C5) and (C8), one obtains
$z=\delta +1$
). Using (C5) and (C8), one obtains
 $v_0=1/(2(\delta +1)^2)\sim 1/(2\delta ^2)$
directed vertically upwards. As with the first contribution, the Stokes drag considerations lead to the result
$v_0=1/(2(\delta +1)^2)\sim 1/(2\delta ^2)$
directed vertically upwards. As with the first contribution, the Stokes drag considerations lead to the result
 $F_{{ev2}}=6\pi v_0=3\pi /\delta ^2$
.
$F_{{ev2}}=6\pi v_0=3\pi /\delta ^2$
.
Third, the temperature field (C2) from the image sphere gives rise not only to an effective uniform temperature increase in the original sphere surrounding, already taken into account in Appendix C2, but also to a (dimensionless) temperature gradient
 $\partial _z T \sim -1/(4\delta ^2)$
. This breaks down the spherical symmetry of the evaporation flux (
$\partial _z T \sim -1/(4\delta ^2)$
. This breaks down the spherical symmetry of the evaporation flux (
 $j$
no longer constant along the sphere surface) and of the evaporative flow (a correction upon (C3)). Hydrodynamically, this can engender an additional force contribution
$j$
no longer constant along the sphere surface) and of the evaporative flow (a correction upon (C3)). Hydrodynamically, this can engender an additional force contribution
 $F_{{ev3}}$
. We proceed with the analysis using the spherical coordinates
$F_{{ev3}}$
. We proceed with the analysis using the spherical coordinates
 $\{r_{{sph}},\theta \}$
related to the original sphere, such that
$\{r_{{sph}},\theta \}$
related to the original sphere, such that
 $r=r_{{sph}} \sin \theta$
and
$r=r_{{sph}} \sin \theta$
and
 $z=\delta +1+r_{{sph}} \cos \theta$
. Then the problem for the mentioned (gradient-related) part of the temperature field around the original sphere can be formulated as
$z=\delta +1+r_{{sph}} \cos \theta$
. Then the problem for the mentioned (gradient-related) part of the temperature field around the original sphere can be formulated as
 \begin{eqnarray} \nabla ^2 T=0 ,\quad \nabla ^2=\partial _{r_{{sph}} r_{{sph}}}+\frac {2}{r_{{sph}}} \partial _{r_{{sph}}} + \frac {1}{r_{{sph}}^2 \sin \theta } \partial _\theta \sin \theta \,\partial _\theta , \end{eqnarray}
 \begin{eqnarray} T=0 \ \ \text {at}\ r_{{sph}}=1 ,\quad T\sim -\frac {1}{4\delta ^2} r_{{sph}} \cos \theta \ \ \text {as}\ r_{{sph}}\to +\infty \, , \end{eqnarray}
to be solved in the domain
 $ r_{{sph}} > 1$
. The infinity in (C10) formally corresponds to
$ r_{{sph}} > 1$
. The infinity in (C10) formally corresponds to
 $1\ll r_{{sph}}\ll \delta$
. The solution of (C9) with (C10) is
$1\ll r_{{sph}}\ll \delta$
. The solution of (C9) with (C10) is
 \begin{equation} T=-\frac {1}{4\delta ^2} \left (r_{{sph}} - \frac {1}{r_{{sph}}^2}\right ) \cos \theta . \end{equation}
Therefore,
 \begin{equation} j=\partial _{r_{{sph}}}T|_{r_{{sph}}=1}=-\frac {3}{4\delta ^2} \cos \theta , \end{equation}
which shows that the present contribution corresponds to evaporation reduction at the upper part of the sphere (
 $j\lt 0$
for
$j\lt 0$
for
 $0\le \theta \lt \pi /2$
) and intensification at the lower part of the sphere (
$0\le \theta \lt \pi /2$
) and intensification at the lower part of the sphere (
 $j\gt 0$
for
$j\gt 0$
for
 $\pi /2\lt \theta \le \pi$
), closer to the substrate, as expected. To calculate the flow induced by (C12), we work once again in terms of the streamfunction, now in the spherical coordinates:
$\pi /2\lt \theta \le \pi$
), closer to the substrate, as expected. To calculate the flow induced by (C12), we work once again in terms of the streamfunction, now in the spherical coordinates:
 \begin{equation} v_{{r}}=\frac {1}{r_{{sph}}^2\sin \theta } \partial _\theta \psi ,\quad v_\theta =-\frac {1}{r_{{sph}}\sin \theta } \partial _{r_{{sph}}} \psi \, \end{equation}
for the
 $r_{{sph}}$
- and
$r_{{sph}}$
- and
 $\theta$
-components of the velocity field. The problem is formulated in the domain
$\theta$
-components of the velocity field. The problem is formulated in the domain
 $r_{{sph}}\gt 1$
. The Stokes equation (cf. e.g. Happel & Brenner Reference Happel and Brenner1965) and the boundary conditions can be written as
$r_{{sph}}\gt 1$
. The Stokes equation (cf. e.g. Happel & Brenner Reference Happel and Brenner1965) and the boundary conditions can be written as
 \begin{eqnarray} E^2 E^2 \psi =0 ,\quad E^2=\partial _{r_{{sph}} r_{{sph}}} + \frac {\sin \theta }{r_{{sph}}^2} \partial _\theta \frac {1}{\sin \theta } \,\partial _\theta , \end{eqnarray}
 \begin{eqnarray} \psi =-\frac {3}{8\delta ^2} \sin ^2\theta ,\ \partial _{r_{{sph}}}\psi =0 \ \ \text {at}\ r_{{sph}}=1 ,\quad \psi /r_{{sph}}^2\to 0 \ \ \text {as}\ r_{{sph}}\to +\infty . \end{eqnarray}
The first condition (C15) corresponds to
 $v_r=j$
(in our dimensionless terms) on account of (C12) and (C13), while the second condition (C15) to no slip (
$v_r=j$
(in our dimensionless terms) on account of (C12) and (C13), while the second condition (C15) to no slip (
 $v_\theta =0$
). The solution of (C14) with (C15) is
$v_\theta =0$
). The solution of (C14) with (C15) is
 \begin{equation} \psi =-\frac {3}{8\delta ^2} \left (r_{{sph}}+\frac {1}{r_{{sph}}}\right ) \frac {\sin ^2\theta }{2}. \end{equation}
The force acting on the sphere in the
 $z$
-direction is determined by
$z$
-direction is determined by
 $(-4\pi )$
times the ‘Stokeslet’ prefactor, i.e. the one at the term
$(-4\pi )$
times the ‘Stokeslet’ prefactor, i.e. the one at the term
 $r_{{sph}}{\sin ^2\theta }/{2}$
(cf. Happel & Brenner Reference Happel and Brenner1965). Thus, from (C16), one obtains
$r_{{sph}}{\sin ^2\theta }/{2}$
(cf. Happel & Brenner Reference Happel and Brenner1965). Thus, from (C16), one obtains
 $F_{{ev3}}=3\pi /(2\delta ^2)$
.
$F_{{ev3}}=3\pi /(2\delta ^2)$
.
Summing up the three contributions, one finally obtains
 $F_{{ev}}=6\pi /\delta ^2$
(as
$F_{{ev}}=6\pi /\delta ^2$
(as
 $\delta \to +\infty$
). It is noteworthy that the asymptotic behaviour remains
$\delta \to +\infty$
). It is noteworthy that the asymptotic behaviour remains
 $O(\delta ^{-2})$
in both limits: as
$O(\delta ^{-2})$
in both limits: as
 $\delta \to +\infty$
and as
$\delta \to +\infty$
and as
 $\delta \to 0$
(cf. Appendix C3). Yet, the prefactors are twice different.
$\delta \to 0$
(cf. Appendix C3). Yet, the prefactors are twice different.
Appendix D. Case of ethanol
Since Celestini et al. (Reference Celestini, Frisch and Pomeau2012) and Lyu et al. (Reference Lyu, Mathai, Wang, Sobac, Colinet, Lohse and Sun2019) have conducted experiments with ethanol droplets, it is worthwhile to compare the present theoretical predictions with those experimental results. Although the predictions match the form and order of magnitude of the experimental results, the agreement is less satisfactory than in the case of water. Specifically, we overestimate the data from Celestini et al. (Reference Celestini, Frisch and Pomeau2012) and underestimate the data from Lyu et al. (Reference Lyu, Mathai, Wang, Sobac, Colinet, Lohse and Sun2019), cf. figure 13. Such multidirectional discrepancies make it challenging to propose a hypothesis that could explain the differences, which might be attributed to experimental errors or some physical ingredient missing in the model that is important for ethanol, but not for water. Further investigation (including experimental) is needed to address this issue.

Figure 13. Relative height
 $\delta =h/R$
of ethanol droplets as a function of
$\delta =h/R$
of ethanol droplets as a function of
 $R$
. The dynamic and quasi-steady master curves are here compared with the experimental data by Celestini et al. (Reference Celestini, Frisch and Pomeau2012) in (a) and Lyu et al. (Reference Lyu, Mathai, Wang, Sobac, Colinet, Lohse and Sun2019) in (b), cf. table 3 for the parameter values.
$R$
. The dynamic and quasi-steady master curves are here compared with the experimental data by Celestini et al. (Reference Celestini, Frisch and Pomeau2012) in (a) and Lyu et al. (Reference Lyu, Mathai, Wang, Sobac, Colinet, Lohse and Sun2019) in (b), cf. table 3 for the parameter values.


 Open access