


1 Introduction
The ability to recover preferences from choice data, and subsequently predict choices from preferences, is fundamental for economic analysis. The revealed preference approach (Samuelson, Reference Samuelson1938, Reference Samuelson1948; Houthakker, Reference Houthakker1950; Arrow, Reference Arrow1959; Richter, Reference Richter1966) essentially views preferences as nothing more than organizing schemes reflecting both observed and predicted choices. More recent accounts have shown that the ‘spirit’ of the revealed preference approach can be conserved under more general conditions. For example, the literature on stochastic choice and random utility models explicitly incorporates variability in choice—a key observation in real-world choice data (Tversky, Reference Tversky1969; Hey and Orme, Reference Hey and Orme1994; Agranov and Ortoleva, Reference Agranov and Ortoleva2017)—by adding random components to true, underlying preferences (McFadden, Reference McFadden and Zarembka1974, Reference McFadden2001). Provided that stable mechanisms govern choice variability, true preferences can still be recovered (e.g., Apesteguía and Ballester, Reference Apesteguía and Ballester2018; Lu and Saito, Reference Lu and Saito2020; Frick et al., Reference Frick, Iijima and Strzalecki2019; Alós-Ferrer et al., Reference Alós-Ferrer, Fehr and Netzer2021). In practice, choice data is universally used to estimate latent and derived concepts ranging from utility functions and risk attitudes to demand functions and social welfare (e.g., Harsanyi, Reference Harsanyi1955; Koopmans, Reference Koopmans1960; Afriat, Reference Afriat1967; Varian, Reference Varian1982; Andreoni and Miller, Reference Andreoni and Miller2002; Cox et al., Reference Cox, Friedman and Sadiraj2008; Deb et al., Reference Deb, Gazzale and Kotchen2014, among many others). The use of choice data, however, entails an implicit but rarely-discussed assumption: stability. Predicting future choices from preferences which themselves are estimated from past choices is only warranted as long as economic agents display well-defined and stable choice patterns (or, at least, stable mechanisms governing choice variability) in the relevant time frame.
Worryingly, the assumption of stable choice patterns (deterministic or stochastic) is at odds with fundamental theories in psychology, which postulate that choices can create and alter preferences (Festinger, Reference Festinger1957; Bem, Reference Bem1967a, Reference Bemb; Slovic, Reference Slovic1995; Simon et al., Reference Simon, Krawezyk and Holyoak2004; Ariely and Norton, Reference Ariely and Norton2008). That is, the mere act of choice, even when no new information is revealed by or after the choice, can lead to fundamental changes in preferences, so that we do not only “choose what we like,” but mechanically also “like what we choose.” Empirical support for such feedback loops between choices and preferences appears to be widespread (Egan et al., Reference Egan, Bloom and Santos2010; Sharot et al., Reference Sharot, Velasquez and Dolan2010; Nakamura and Kawabata, Reference Nakamura and Kawabata2013; Johansson et al., Reference Johansson, Hall, Tärning, Sikström and Chater2014). These alleged preference changes occur within the time span of a few minutes and in the absence of any new, choice-relevant information. They are therefore fundamentally problematic for economics. If such effects extend to economic choices, every choice-based preference elicitation procedure bears the potential to interfere with the very concept it ought to measure. Observed economic choices may then permanently lag behind current preferences, and standard economic applications estimating utilities, demand, and social welfare may be systematically biased.
In light of its potential consequences, it is of paramount importance to investigate the economic validity and significance of this mere choice effect. Evidence from psychology is insufficient to settle the question, due to difficulties with the experimental paradigms applied in that literature (see next section), the hypothetical nature of choices in such studies, and the non-economic nature of the alternatives they study. This paper undertakes the endeavor of establishing the validity of the mere choice effect (preference change due purely to the act of choice) relying on incentivized choices. We develop a parsimonious experimental design that allows researchers to isolate the effect of mere, uninformative choices on future choices in an economically-relevant domain (binary monetary gambles or lotteries). In essence, our experimental design first presents participants with two choice options (lotteries), but, crucially, the experimenter randomly determines whether a certain choice option is transparently inferior or superior (through stochastic dominance). As choices are incentivized, it is in the best interest of participants to choose the objectively superior option and hence follow the pre-determined, randomized choice patterns. Further choices in the experiment then test for preference change in favor or against the previous options. In this way, the design effectively randomizes uninformative (mere) choices. We hereby solve typical issues encountered in the existing literature: unreliable preference measures, hypothetical bias, and deception (we will elaborate on these issues in the next section).
This paper reports the results of a large-scale, preregistered online experiment (the paper was evaluated at the journal previous to data collection) relying on the basic design described above. The mere choice effect was assessed by measuring whether merely-chosen options were subsequently chosen more often than merely-rejected ones. The results hence allow us to establish whether or not the mere choice effect is relevant for economics and whether or not it is warranted to maintain a unidirectional link between choices and preferences in the domain we study. Hereby, we contribute to a stream of literature that discusses the possibility of past experiences shaping future preferential choices. For example, the literature on preference discovery postulates that decision makers do not know their true tastes until they (incompletely) discover them through consumption experience (Plott, Reference Plott, Arrow, Colombatto, Perlman and Schmidt1996; Braga and Starmer, Reference Braga and Starmer2005; Delaney et al., Reference Delaney, Jacobson and Moenig2020). Naturally, past choices are a vital input source for the discovery process. Frick et al. (Reference Frick, Iijima and Strzalecki2019), on a related note, discuss in their concluding remarks that their dynamic random utility framework could accommodate endogenously evolving preferences (as a function of the agent’s past consumption level). This could take the form of habit formation or simply reflect the fact that past consumption provides payoff-relevant information. In contrast, in this paper we aimed to establish whether past choices affect future choices even when there is nothing to be learned from them. A possible mechanism would be that decision makers, to some extent, are used (or hard-wired) to learn from past choices and they mistake uninformative choices for informative ones. This could result in “decision inertia” as studied by Alós-Ferrer et al. (Reference Alós-Ferrer, Hügelschäfer and Li2016b) even in cases where objectively superior options are available (see also Jung et al., Reference Jung, Erdfelder, Broeder and Dorner2019). For example, Cerigioni (Reference Cerigioni2017) studies how past exposure to a choice option creates inertia or stickiness towards the exposed option. This stickiness, known as the mere exposure effect (Zajonc, Reference Zajonc1968,, Reference Zajonc2001), may explain behavioral regularities like the status-quo bias, and could at least partially drive the mere choice effect (we will discuss this latter possibility below).
We committed to our conditional conclusions prior to data collection. In case supporting evidence for the mere choice effect would have been found, the intention of our work was to contribute to the development of better and more predictively-accurate preference elicitation methods. For example, if preference change followed regular patterns, standard elicitation procedures could be corrected by taking into account quantitative predictions about the expected magnitude of preference change. However, our experiment found no supporting evidence for the mere choice effect. Merely-chosen and merely-rejected lotteries were subsequently chosen with almost identical frequencies, which in turn were almost identical in magnitude to a baseline measurement. Since our study had sufficient power, the conclusion is that the effects reported in psychology are likely to be too small for economic choices to merit sparking a major reevaluation of economic methods.
The remainder of the paper is structured as follows. Sect. 2 reviews the existing literature on choice-induced preference change and briefly discusses the main theory underlying the effect. Sect. 3 presents our experimental design, including the derivation of our main hypothesis and the power analysis. Sect. 4 presents the statistical analyses (as planned before data collection and actually carried out) and discusses the interpretation of the results and Sect. 5 concludes. Additional results and supplementary experimental materials (experimental instructions and screenshots) are presented in the online appendix.
2 Literature review: choice-induced preference change
Psychological theories that explain how choices can create preferences often draw an analogy between how we make inferences about others’ preferences and how we make inferences about our own preferences (Bem, Reference Bem1967a, Reference Bemb; Ariely and Norton, Reference Ariely and Norton2008). As we cannot fathom what others feel and think, we infer their preferences and beliefs by what we can observe: their behavior. If we observe a stranger on the street giving money to a homeless person, we infer that the stranger is altruistic. Analogously, if our own preferences are vague, imprecisely formulated, or incomplete, we cannot fathom what we ourselves feel and think. Thus, we infer our own preferences from what we can observe: our own past behavior. Imagine a consumer standing in front of a drug-store shelf filled with many shampoo brands. One particular brand catches her eye. She is not quite certain of whether she likes the brand or not, but remembers buying it in the past. She deduces that there must have been a good reason for that decision. Being a rational consumer, the shampoo must have fulfilled her needs. She infers that she likes the shampoo and buys it again. This line of reasoning can lead us astray because memory often inaccurately captures hedonic experiences. For example, it is well understood that unrelated situational factors can impact behavior and that we are not always aware of their influence (Slovic, Reference Slovic1995; Ariely et al., Reference Ariely, Loewenstein and Prelec2003; Ariely and Norton, Reference Ariely and Norton2008; see, however, Fudenberg et al., Reference Fudenberg, Levine and Maniadis2012 and Maniadis et al., Reference Maniadis, Tufano and List2014). Maybe the consumer correctly remembers buying the shampoo, but forgets having been in a rush that day, or that the shampoo was part of a promotional deal. In that case, her self-inference process was based on an inaccurate recollection of a past event. This is the logic behind the mere choice phenomenon, with the only caveat that, in psychology, processes of preference change are assumed to happen subconsciously. Uninformative (mere) choices can serve as input factors for the self-inference process, which itself may then lead to wrongly imputed preferences.Footnote 1
Most of the relevant evidence on preference change in psychology has been collected using the following three-stage setup. In stage 1, participants rate or rank certain objects, like artistic paintings, on their desirability. In stage 2, they are asked to make a choice between two previously-rated objects. Participants are led to believe that they have made a free choice, but, in reality, researchers use some form of deceptive technique to manipulate choice and randomly determine what was chosen and rejected, e.g. alleged subliminal choice (Sharot et al., Reference Sharot, Velasquez and Dolan2010). In the third and final stage, objects are rated or ranked again. Preference change is measured by comparing how much chosen objects have increased in self-reported desirability relative to rejected objects. The typical finding is that chosen objects are reevaluated upwards and non-chosen ones are reevaluated downwards, even if choices were randomly assigned. If preferences are stable, one should have observed no changes in desirability.
In spite of an apparently-overwhelming body of evidence, economists should be skeptical about the relevance of the mere choice phenomenon as currently established. First, the extant literature typically studies the effect of past choice on future desirability measures, e.g., liking ratings or rankings (Sharot et al., Reference Sharot, Velasquez and Dolan2010; Nakamura and Kawabata, Reference Nakamura and Kawabata2013). In economics, the most relevant data source is actual choices, and preferences are just binary relations organizing those choices, which decision makers might or might not have conscious access to. Whether (typically unincentivized) desirability measures proxy choice data sufficiently well is not self-evident (Cason and Plott, Reference Cason and Plott2014). Hence, it is important to establish the mere choice effect on actual, subsequent choices and not only self-reported desirability scales. Second, the available experimental evidence exclusively investigates preferences in hypothetical choice scenarios over ill-defined options, which do not reference all preference-relevant option dimensions (Egan et al., Reference Egan, Bloom and Santos2010). Examples include hypothetical holiday destinations described by their destination names only, or the attractiveness of human faces (Sharot et al., Reference Sharot, Velasquez and Dolan2010; Johansson et al., Reference Johansson, Hall, Tärning, Sikström and Chater2014). In such cases, behavior might be extremely noisy and easily swayed by irrelevant factors (Murphy et al., Reference Murphy, Allen, Stevens and Weatherhead2005; Fudenberg et al., Reference Fudenberg, Levine and Maniadis2012). The hypothetical bias identified in related domains casts doubts on whether the behavior observed in such paradigms is informative enough to study preference change (Hertwig and Ortmann, Reference Hertwig and Ortmann2001; Murphy et al., Reference Murphy, Allen, Stevens and Weatherhead2005; Harrison and Rutström, Reference Harrison, Rutström, Plott and Smith2008). Third, the existing literature has adopted research designs that deceive participants to achieve experimental control. For example, experimenters give wrong feedback about past choice using card tricks (swapping choices) or present cover stories about subliminal decision making and have a computer prompt a random choice (Sharot et al., Reference Sharot, Velasquez and Dolan2010; Nakamura and Kawabata, Reference Nakamura and Kawabata2013; Johansson et al., Reference Johansson, Hall, Tärning, Sikström and Chater2014). Deception is obviously inappropriate in experimental economics and, through lab reputation, would render any incentivized design ineffective. In summary, it remains unresolved whether actual choices, in contrast to perceived and make-believe choices, lead to preference change.
It needs to be pointed out that a large part of the literature on choice-induced preference change in psychology has studied a related but different question, namely whether and how choices involving some sort of tradeoff change preferences (Brehm, Reference Brehm1956; Harmon-Jones and Mills, Reference Harmon-Jones and Mills1999; Shultz et al., Reference Shultz, Léveillé and Lepper1999; Jarcho et al., Reference Jarcho, Berkman and Lieberman2011; Alós-Ferrer et al., Reference Alós-Ferrer, Granić, Shi and Wagner2012; Izuma and Murayama, Reference Izuma and Murayama2013). The dominant theory behind such effects is cognitive dissonance (Festinger, Reference Festinger1957; Akerlof and Dickens, Reference Akerlof and Dickens1982). In a nutshell, the underlying hypothesis is that a choice involving tradeoffs creates dissonance (psychological discomfort). Dissonance arises, because the chosen option has some negative characteristics and the rejected option has some positive ones (i.e., tradeoffs). The decision makers unconsciously reduce this dissonance by adjusting their preferences. Hereby, they reevaluate the chosen options up and rejected ones down. However, it has been recently shown that the experimental paradigm which has guided the development of this literature for over 50 years is regrettably flawed. It contains a statistical bias that can result in apparent preference change even if participants have stable preferences (Chen and Risen, Reference Chen and Risen2010; Izuma and Murayama, Reference Izuma and Murayama2013; Alós-Ferrer and Shi, Reference Alós-Ferrer and Shi2015). Although some improved designs have been proposed (e.g., Alós-Ferrer et al., Reference Alós-Ferrer, Granić, Shi and Wagner2012), how the effect of tradeoff choices in economically-relevant domains could be studied remains an unresolved issue at the time of writing. Although beyond the scope of the current paper, it would of course also be valuable for economics to understand if and when tradeoff choices change preferences. This work, however, concentrates on the mere choice effect, which more clearly isolates the possible effects of the act of choice on preferences.
Finally, it should be pointed out that the mere choice effect may be related to a general tendency in decision makers to develop a ‘preference’ for alternatives merely because they have been exposed to them. This tendency, know as the mere exposure effect, is robust and has been replicated across many domains (Zajonc, Reference Zajonc1968; Bornstein, Reference Bornstein1989; Monahan et al., Reference Monahan, Murphy and Zajonc2000; Zajonc, Reference Zajonc2001). It may be the case that exposure is asymmetric, stronger for chosen options than for non-chosen ones (see, e.g., Alós-Ferrer et al., Reference Alós-Ferrer, Hügelschäfer and Li2016b; Cerigioni, Reference Cerigioni2017). In this view, preference changes are then not caused by the act of choosing, but by exposure alone. Returning to the example at the beginning of this section, imagine that the consumer remembers her reasoning process, but forgets what choice it led her to. Asymmetric mere exposure would nevertheless predict an increase in ‘preference’ for the chosen shampoo, at least against options which were not visible or available at the time. We will provide a critical discussion of how the mere exposure effect might affect our experiment and the results we find in Sect. 4.
3 Experimental design and procedures
3.1 Design and main hypothesis
We developed a novel experimental design that bypasses all of the critiques and difficulties mentioned above. First, we study the impact of past choices on subsequent ones, and hence our dependent variable are choices, the most relevant preference measure in economics. Second, we do so using lotteries. Lotteries have well-defined, objective, and economically-relevant characteristics (probabilities and monetary outcomes). This allows us to induce monetary incentives, which eliminates any potential hypothetical bias. Finally, we achieve control over initial choices without using any form of deception. To this end, we exploit the well-defined structure of lotteries. In our design, initial choices are made between a fixed target lottery, a, and a new lottery, c, which is constructed on the spot. We randomly determine at the participant-level whether the constructed lottery c is transparently inferior or superior monetary-wise to the target lottery a. Assuming only that participants prefer more money over less money, they should follow the randomly pre-determined choice patterns. If c is inferior, participants should choose the target lottery a. If c is superior, participants should reject a. We call these predicted choices mere choices, as they do not reveal any new information about the underlying preferences over lotteries. After mere choices, we subsequently elicit choices between the target lottery a and a fixed, not-previously-encountered third lottery b. Call this choice the preference choice (a, b). Crucially, preference choices involve tradeoffs and a is neither superior nor inferior to b in a dominance sense. The mere choice effect can now be measured precisely. If mere choices change the desirability of lottery a, we can expect lotteries a that were merely-chosen to be more attractive than comparable lotteries a that were merely-rejected. This in turn should impact the choice frequencies in preference-choices (a, b). Merely-chosen lotteries a should be chosen more often than merely-rejected lotteries a in preference-choices (a, b). We can formulate our main research hypothesis as follows:
H1: Frequency(a chosen over b
 a is merely-chosen) >
Frequency(a chosen over b
 a is merely-rejected)
3.2 Procedures
Table 1 Sample demographics. N and
 represent absolute and relative frequencies, respectively. Percentages in
 columns were calculated excluding “Prefer not to disclose” (PNTD) answers. Percentages in UK% columns represent the most recent UK adult population figures taken from the UK Office for National Statistics and the OECD

|
N |
|
UK% |
|
|---|---|---|---|
|
Household income |
|||
|
Less than 19,000 |
199 |
25 |
17 |
|
19,000 to 31,999 |
197 |
25 |
28 |
|
32,000 to 47,999 |
157 |
20 |
24 |
|
48,000 to 63,999 |
125 |
16 |
14 |
|
64,000 or more |
105 |
14 |
17 |
|
Prefer not to disclose (PNTD) |
57 |
– |
– |
|
Total |
840 |
100.0 |
100.0 |
|
Highest education level |
|||
|
No academic or professional qualifications |
7 |
1 |
7.9 |
|
Level-1 |
35 |
4 |
9.9 |
|
Level-2 |
68 |
8 |
15.7 |
|
Trade Apprenticeship |
10 |
1 |
2.9 |
|
Level-3 |
231 |
28 |
16.8 |
|
Level-4+ |
474 |
58 |
40.2 |
|
Other |
0 |
0 |
6.6 |
|
PNTD |
15 |
– |
– |
|
Total |
840 |
100.0 |
100.0 |
|
Student status |
|||
|
Yes |
227 |
27 |
5.7 |
|
No |
599 |
73 |
94.3 |
|
PNTD |
14 |
– |
– |
|
Total |
840 |
100.0 |
100.0 |
|
Gender |
|||
|
Female |
553 |
66 |
50.6 |
|
Male |
276 |
33 |
49.4 |
|
Other |
8 |
1 |
– |
|
PNTD |
3 |
– |
– |
|
Total |
840 |
100.0 |
100.0 |
|
Employment status |
|||
|
Full-time |
373 |
46 |
NA |
|
Part-time |
177 |
22 |
NA |
|
Not in paid work |
262 |
32 |
NA |
|
PNTD |
28 |
– |
– |
|
Total |
840 |
100.0 |
NA |

We conducted an online experiment to investigate the economic validity of the mere choice effect and test our main research hypothesis (H1). Participants were recruited via the research platform Prolific and sampled from a U.K. general population.Footnote 2 Table 1 presents the descriptive statistics on the sample demographics. The sample shows the typical characteristics of an online panel (mean age was 33.1 years, SD
 11.8).
Each participant made 16 choices in total, each between two lotteries with two monetary outcomes and two probabilities. Eight choices were of the type (a vs. c), the remaining eight ones of the type (a vs. b). We implemented a standard between-participants design and randomized whether target lotteries a were inferior or superior to constructed lotteries c at the participant level. Lotteries were presented as icon arrays and we used a colored-balls-in-a-box framing (Garcia-Retamero and Galesic, Reference Garcia-Retamero and Galesic2010; Dambacher et al., Reference Dambacher, Haffke, Groß and Hübner2016). All relevant design aspects of the presentation format were counterbalanced, e.g. colors, the position of the lotteries on screen, or the order of presentation within stages. Figure 1 summarizes the experimental design using sample screenshots and Table 2 shows the lotteries used in the experiment, each row representing one (a, b) lottery pair.
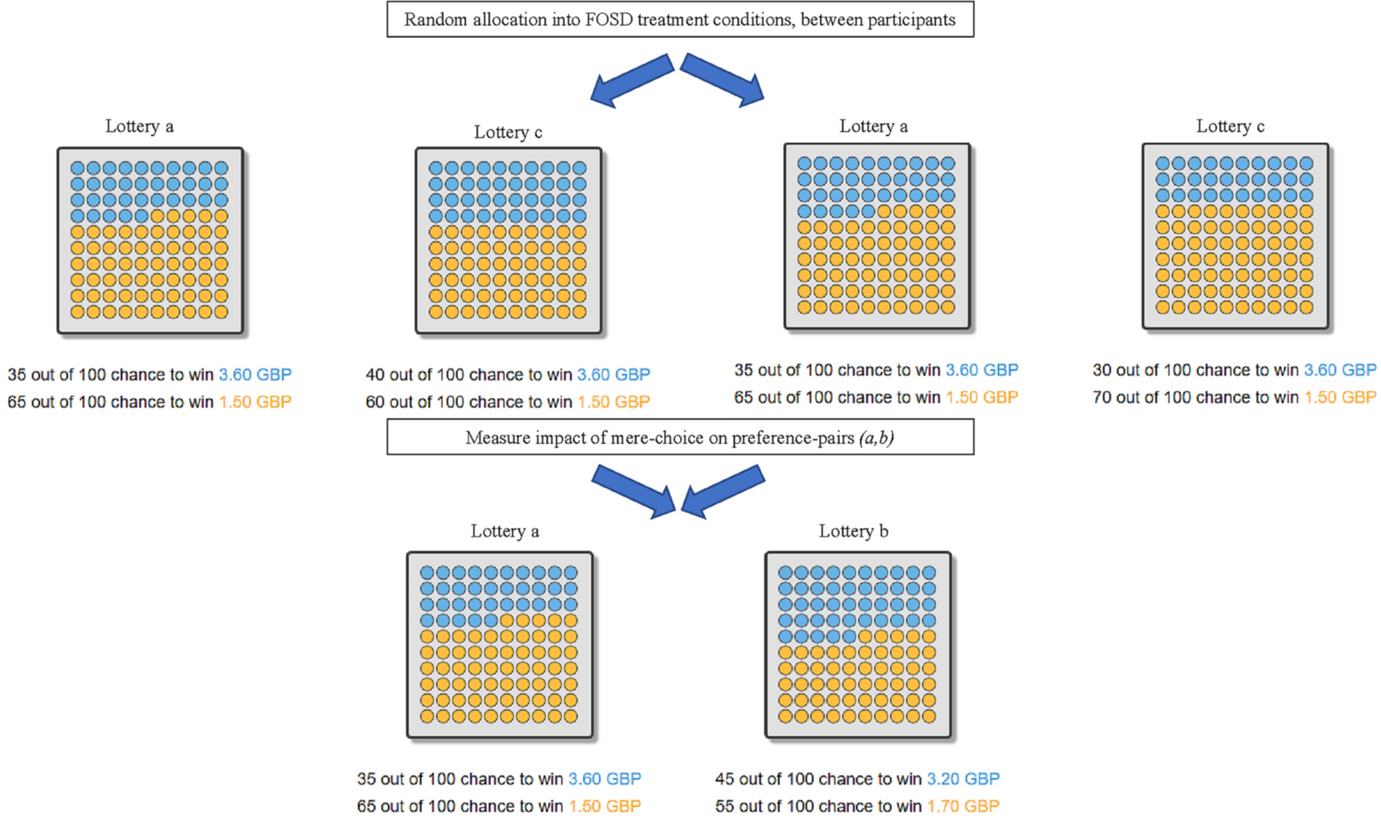
Fig. 1 Schematic overview experimental design, including screenshots from actual decision screens. Lottery labels a, b, and c are for illustrative purposes only, and were not shown to participants
All participants first went through a standard attention screening, a typical procedure to reduce noise in online experiments (Oppenheimer et al., Reference Oppenheimer, Meyvis and Davidenko2009).Footnote 3 After passing the attention check, participants received detailed instructions on our lottery presentation format. They were then required to answer a small control quiz ensuring that they understood the lottery presentation format. After passing the quiz, each participant faced two decision stages, a mere-choice task in stage 1 and a preference-choice task in stage 2. In both choice tasks, participants were presented with pairs of lotteries, one pair at a time. They were instructed to choose the lottery they preferred in each pair.
The mere-choice task in stage 1 consisted of eight pairs of lotteries. Each mere-choice pair displayed one target lottery of type a (see Table 2) and a new lottery c constructed on the spot. Lotteries c were constructed to induce predetermined choice patterns and did not replicate any of the lotteries from Table 2. For the construction of c, we relied on transparent first-order stochastic dominance (FOSD). A lottery a first-order stochastically dominates another lottery c if for any monetary outcome x, a gives at least as high a probability of receiving at least x as does c, with strictly higher probability for some x. If a lottery first-order stochastically dominates another lottery, the former is objectively superior, independently of underlying risk preferences, as long as participants prefer larger amounts of money over smaller ones (the same remains true if decision makers are described correctly by cumulative prospect theory or rank-dependent utility instead of expected utility theory).
In the experiment, participants were randomly assigned to one of two possible treatments. In the CHOOSE treatment, all lotteries of type a dominated the corresponding c-type lotteries. Participants who obeyed FOSD thus ‘merely-chose’ a. In the REJECT treatment, the FOSD relationship was reversed so that participants obeying FOSD ‘merely-rejected’ a. To obtain transparent FOSD relationships, we changed one lottery attribute keeping the other one constant. For robustness reasons, we split the treatments into sub-treatments at the participant level, randomly determining whether probabilities were changed or whether monetary outcomes were changed (more details are provided below).
Our experimental set-up shares some elements with the standard asymmetric dominance / decoy effect design (Huber et al., Reference Huber, Payne and Puto1982; Herne, Reference Herne1999; Sürücü et al., Reference Sürücü, Djawadi and Recker2019). That is, lottery c in the CHOOSE treatment is dominated by a, but not by b, making a more attractive than b as a result of the decoy effect. However, we remark that in our design the three lotteries are never presented on the same screen, but rather sequentially. Nevertheless, the decoy effect could still be present in our sequential presentation format, confounding the mere choice effect. We therefore implemented an additional sub-treatment in the CHOOSE condition to control for the decoy effect. When constructing c, we made lottery c so inferior monetary-wise that it was dominated by both a and b. We call such c-lotteries junk lotteries. With junk lotteries there is no asymmetric dominance present, and the decoy effect is shut down. To preserve symmetry between conditions, we used an analogous design for the REJECT condition. That is, star c-lotteries were made so attractive monetary-wise that they dominated both a and b.
The sub-treatments discussed above were counterbalanced between participants, yielding a 2
 3 between-participants design with a total of six experimental conditions: CHOOSE with FOSD manipulation by probability, CHOOSE with FOSD manipulation by outcome, CHOOSE with junk-FOSD manipulation by outcome, REJECT with FOSD manipulation by probability, REJECT with FOSD manipulation by outcome, and REJECT with star-FOSD manipulation by outcome.Footnote 4 Figure 1 includes a schematic overview of our FOSD construction for the probability domain. Randomization into treatments occurred after passing the control quiz.
The preference-choice task in stage 2 followed a setup analogous to the mere-choice task. It consisted of eight pairs of lotteries. Each preference pair presented one target lottery a and the corresponding lottery b given in the same row in Table 2. We thus had eight fixed preference pairs of the form (a, b) as given in Table 2.
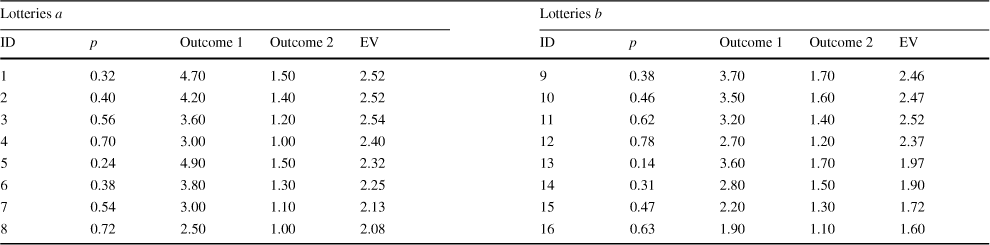
Table 2 Lotteries used in experiment. Lotteries pay amount Outcome 1 with probability p, and Outcome 2 with probability
 . All outcomes are in British Pounds (£), as Prolific is UK-based and compensates participants in £
|
Lotteries a |
Lotteries b |
|||||||||
|---|---|---|---|---|---|---|---|---|---|---|
|
ID |
p |
Outcome 1 |
Outcome 2 |
EV |
ID |
p |
Outcome 1 |
Outcome 2 |
EV |
|
|
1 |
0.32 |
4.70 |
1.50 |
2.52 |
9 |
0.38 |
3.70 |
1.70 |
2.46 |
|
|
2 |
0.40 |
4.20 |
1.40 |
2.52 |
10 |
0.46 |
3.50 |
1.60 |
2.47 |
|
|
3 |
0.56 |
3.60 |
1.20 |
2.54 |
11 |
0.62 |
3.20 |
1.40 |
2.52 |
|
|
4 |
0.70 |
3.00 |
1.00 |
2.40 |
12 |
0.78 |
2.70 |
1.20 |
2.37 |
|
|
5 |
0.24 |
4.90 |
1.50 |
2.32 |
13 |
0.14 |
3.60 |
1.70 |
1.97 |
|
|
6 |
0.38 |
3.80 |
1.30 |
2.25 |
14 |
0.31 |
2.80 |
1.50 |
1.90 |
|
|
7 |
0.54 |
3.00 |
1.10 |
2.13 |
15 |
0.47 |
2.20 |
1.30 |
1.72 |
|
|
8 |
0.72 |
2.50 |
1.00 |
2.08 |
16 |
0.63 |
1.90 |
1.10 |
1.60 |
|
To incentivize decisions, we implemented a random lottery incentive system (Cubitt et al., Reference Cubitt, Starmer and Sugden1998). A participant’s payment for the experiment was derived by selecting one of the sixteen lottery pairs from stage 1 and stage 2 at random. The participant then received the lottery she had chosen and that lottery was played out. This was done after all decision-relevant data was collected. On the basis of past experience with comparable experiments, the experiment was expected to last about 7 minutes and yield an average remuneration of £3.04.Footnote 5 Actual average duration was 6 minutes and 34 seconds, and actual average remuneration was £3.09.
The lotteries in Table 2 were designed such that no FOSD relation obtains among any preference pair (a, b); lotteries of type c do not duplicate any of the existing lotteries a or b; all lotteries are non-degenerate, i.e., no certainty is involved; and the expected average payment of the experiment meets the current standards in experimental economics. The first four (a, b)-lottery pairs from Table 2 are hard / difficult decisions, because they involve a clear tradeoff, while the last four pairs are comparatively easier (see Sect. 4 for more details). The online appendix contains screenshots of all phases of the experiment.
3.3 Measuring and testing the mere choice effect
In our design, the mere choice effect on future choices can be measured precisely. In preference-choices (a, b), merely-chosen target lotteries a should be chosen more often than merely-rejected target lotteries a. This effect is causal, because it was randomly determined whether the target lottery was merely-chosen or merely-rejected. Statistical significance is assessed via a Mann-Whitney-U (MWU) test, one-tailed as our hypothesis is directional. For the test, we count for each participant how often she chose lottery a in preference choices (a, b) (from 0 to 8). Let
 and
and
 denote one randomly drawn choice-count observation from each of the two treatments CHOOSE and REJECT, respectively. The MWU tests the following statistical hypotheses:Footnote 6
H0: Probability


Ha: Probability
 >
>
 .
.
We committed to conclude to have found supportive evidence of a mere choice effect if and only if the MWU test was significant at the 5% level.
3.4 Power calculations
We expected a small effect size and hence set
 for power calculations (Cohen, Reference Cohen1988, Reference Cohen1992); for example, the related literature on choice-induced preference change in psychology reports an average effect size of
 (Izuma and Murayama, Reference Izuma and Murayama2013). Setting
 ,
,
 , and
, and
 , the a priori required sample size for a one-tailed MWU test is 650 participants, equally split between treatments. Hence, the research question is best tackled by a large-sample but rather short experiment, and hence an online platform is ideal.
3.5 FOSD and exclusion criteria
To ensure that the FOSD manipulation induced behavior as expected, independently of other factors, we aimed to maximize the transparency of FOSD relationships. We therefore changed one lottery attribute keeping the other one constant. In the probability domain, FOSD relationships were established by adding or subtracting five percentage points in probabilities for the higher outcome. In the outcome domain, we added or subtracted 20 pence to or from the high outcome. To create junk (star) type-c lotteries, the highest (lowest) outcome in c was set equal to the lowest (highest) outcome in both a and b lotteries. For example, let (x, p; y) denote a lottery that pays x with probability p and y with the complementary probability
 . Let the target lottery be
 and
and
 . Suppose we wish to construct a lottery c so that a is to be chosen in the pair (a, c). In the probability domain, we would construct
 . In the outcome domain, we would either set
 or junk-
 . In the former case, c pays the same amounts as a, but entails a lower probability to win the higher amount. In the latter case, c simply pays less money, but the probabilities are the same as in a. If behavior follows FOSD, participants are expected to choose a in all three cases.
However, it is possible that some participants violate FOSD, e.g. due to lack of attention. We committed to excluding participants who violate FOSD in at least one of the eight mere-choice pairs from the analysis. Alós-Ferrer et al. (Reference Alós-Ferrer, Granić, Kern and Wagner2016a) conducted a laboratory experiment with a standard student population. The authors included FOSD-choice pairs similar to ours as a basic rationality check in their experiment, which was designed to test an unrelated phenomenon (the preference reversal phenomenon). The authors report extremely low FOSD violation rates (around 2%). As in Alós-Ferrer et al. (Reference Alós-Ferrer, Granić, Kern and Wagner2016a), we use incentivized choice, and our lottery presentation format relies on icon-arrays which communicate risk understandably to lay audiences (Garcia-Retamero and Galesic, Reference Garcia-Retamero and Galesic2010; Dambacher et al., Reference Dambacher, Haffke, Groß and Hübner2016). Taking into account the noisier online environment, we therefore expect FOSD violations rates of 5%. We conservatively set to obtain the required number of 650 observations after a 5% of exclusions, leading to a required number of participants of 682, which we conservatively rounded up to 720. We additionally invited 120 participants to complete a baseline measurement treatment for choice frequencies in (a, b)-pairs. Further information regarding this baseline treatment is provided later on. In total, we thus recruited 840 participants. We committed to performing our main tests with all remaining participants after excluding those who violated FOSD at least once.
This exclusion is based on objective criteria and does not compromise a causal interpretation of our results. First, the two treatments CHOOSE and REJECT only differ with respect to whether c is objectively better or worse than a. Otherwise, they are identical. Participants are blind with regard to the identities of the lotteries, they do not know which lottery is of type a, c, or b. Hence, FOSD violations are pure noise and we do not expect FOSD violation rates to vary across treatments.Footnote 7 Second, mere choices do not carry any a priori relevant information for preference pairs (a, b). Hence, our exclusion criterion does not condition on any relevant information with regard to the measurement of the mere choice effect. Admittedly, one can take the position that excluding participants limits the generalizability of our conclusions, and that all results stated hold only for the subset of participants who obey FOSD in the mere-choice task (or actually pay attention to the task). However, we expected this subset to be large.
4 Results
4.1 FOSD violations
In total we recruited 720 participants for the CHOOSE and REJECT treatments. We had to exclude 2 participants as their choices were not recorded properly. We thus observed 5,744 (718 participants
 8 decisions) decisions in which one lottery dominated the other one in the FOSD sense in stage 1. Only a small fraction of these decisions violated FOSD in CHOOSE and REJECT, respectively 134 (4.7%) and 154 (5.4%). We further split up the data across manipulation domains, i.e., outcomes, outcomes star/junk and probabilities. FOSD violation rates were again low, respectively 118 (6.1%), 24 (1.3%) and 146 (7.6%). Following our plan, we excluded 132 of the 718 participants since they violated FOSD at least once, leaving us with 586 participants for our main analysis, 298 in CHOOSE and 288 in REJECT. Unless otherwise stated, our analysis is based on the sample of 586 participants who obeyed FOSD in all of their choices in stage 1.
4.2 Mere choice effect
The left-hand side of Fig. 2 plots the average number of times that lottery a was chosen across participants (0 to 8) for the CHOOSE and REJECT treatments. With 6.05 in the CHOOSE treatment vs. 6.02 in the REJECT treatment, the participant-average count of choices for a in (a, b) in treatment CHOOSE was almost identical to the one in treatment REJECT (medians were 6 and 6, respectively). These observations are corroborated by a one-sided MWU test on differences in the distribution of a-choices between treatments (
 0.33,
0.33,
 0.37), see Sect. 3.3. Uninformative mere choices did not significantly increase the choice frequencies of merely-chosen lotteries. For illustrative purposes, the right-hand side of Fig. 2 also plots the choice frequencies for lottery a in preference pairs (a, b) for the CHOOSE and REJECT treatments, for each of the eight preference pairs (a, b) separately. Against our main hypothesis, we observe that merely-chosen lotteries a were chosen at the same rates as comparable, but merely-rejected lotteries a in all preference pairs.
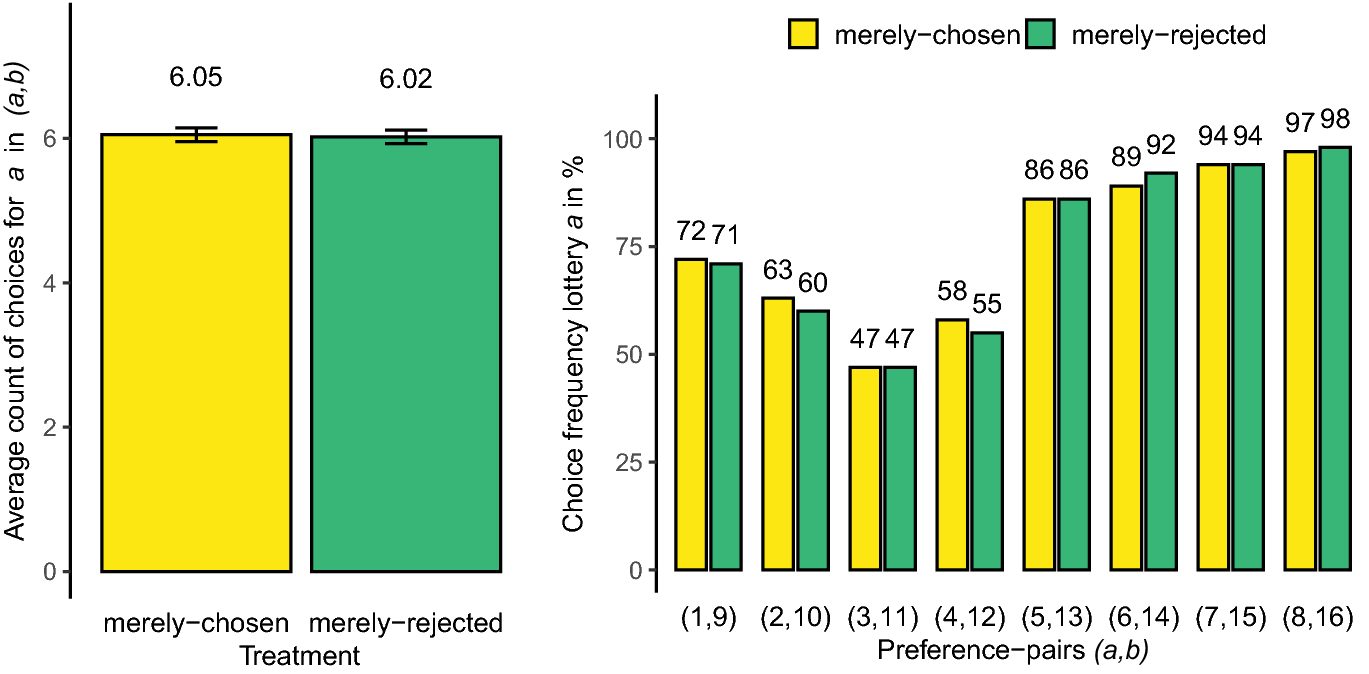
Fig. 2 Left-hand panel: Average count of choices for lottery a in
 across mere-choice treatments. Right-hand panel: Choice frequencies for lottery a across preference pairs
 and mere-choice treatments
4.3 Robustness analysis
We ran panel probit regressions with participant random-effects to confirm our main analysis on the mere choice effect. Our sample comprises all decisions made in stage 2 of the experiment excluding participants who violated FOSD at least once in stage 1. Our dependent variable is the Choice dummy, taking the value 1 if a participant chose a in (a, b). Reported are average marginal effects with cluster-robust standard errors in parentheses (that is, treating each individual as a cluster). The corresponding results are presented in Table 3, Models (1) and (2).
Table 3 Panel probit regressions on Choice dummy (choose a in (a, b)) with participant random-effects in Models (1) to (4). Reported are average marginal effects with cluster-robust standard errors in parentheses. Model (5) reports the results of a panel linear probability model with participant random-effects and cluster-robust standard errors in parentheses

|
Dependent variable |
Choice dummy, choose a in (a, b) |
||||
|---|---|---|---|---|---|
|
Model |
(1) |
(2) |
(3) |
(4) |
(5) |
|
Merely-Chosen |
0.004 |
0.013 |
− 0.005 |
− 0.001 |
|
|
(0.017) |
(0.016) |
(0.015) |
(0.015) |
||
|
CHOOSE |
0.012 |
||||
|
(0.020) |
|||||
|
CHOOSE-JUNK |
0.013 |
||||
|
(0.025) |
|||||
|
REJECT-STAR |
0.000 |
||||
|
(0.025) |
|||||
|
Hard |
− 0.266** |
||||
|
(0.024) |
|||||
|
Merely-Chosen
|
0.027 |
||||
|
(0.027) |
|||||
|
Position screen: Right |
0.036*** |
0.037*** |
0.036*** |
0.036*** |
|
|
(0.011) |
(0.010) |
(0.011) |
(0.011) |
||
|
Winning color: Orange |
0.020 |
0.022 |
0.020 |
0.019 |
|
|
(0.016) |
(0.015) |
(0.016) |
(0.016) |
||
|
Female |
− 0.053*** |
− 0.059*** |
− 0.053*** |
− 0.056*** |
|
|
(0.017) |
(0.016) |
(0.017) |
(0.017) |
||
|
Age |
− 0.002* |
− 0.003*** |
− 0.002* |
− 0.002** |
|
|
(0.001) |
(0.001) |
(0.001) |
(0.001) |
||
|
Student status (baseline NO)) |
|||||
|
YES |
− 0.050* |
− 0.44* |
− 0.050* |
− 0.053* |
|
|
(0.027) |
(0.024) |
(0.028) |
(0.028) |
||
|
PNTD |
0.048 |
− 0.001 |
− 0.001 |
0.040 |
|
|
(0.056) |
(0.060) |
(0.056) |
(0.053) |
||
|
Education level (baseline Level-1) |
|||||
|
No qualification |
0.061 |
0.007 |
0.061 |
0.055 |
|
|
(0.112) |
(0.088) |
(0.112) |
(0.104) |
||
|
Level-2 |
0.085 |
0.007 |
0.085 |
0.084 |
|
|
(0.056) |
(0.052) |
(0.056) |
(0.057) |
||
|
Trade apprenticeship |
0.081 |
− 0.063 |
0.081 |
0.067 |
|
|
(0.112) |
(0.116) |
(0.113) |
(0.117) |
||
|
Level-3 |
0.040 |
− 0.008 |
0.041 |
0.038 |
|
|
(0.051) |
(0.046) |
(0.052) |
(0.052) |
||
|
Level-4+ |
0.102** |
0.040 |
0.102** |
0.101** |
|
|
(0.047) |
(0.045) |
(0.049) |
(0.049) |
||
|
PNTD |
− 0.027 |
− 0.060 |
− 0.027 |
− 0.025 |
|
|
(0.080) |
(0.068) |
(0.080) |
(0.075) |
||
|
Employment status (baseline Full-time)) |
|||||
|
Part-time |
0.048** |
0.047** |
0.048** |
0.046 |
|
|
(0.024) |
(0.022) |
(0.024) |
(0.024) |
||
|
Not in paid work |
0.050** |
0.046** |
0.050** |
0.055** |
|
|
(0.023) |
(0.022) |
(0.023) |
(0.025) |
||
|
PNTD |
0.001 |
0.009 |
0.008 |
0.008 |
|
|
(0.044) |
(0.041) |
(0.044) |
(0.045) |
||
|
Income (baseline < 19,000 )) |
|||||
|
19,000 to 31,999 |
− 0.002 |
0.012 |
− 0.002 |
− 0.002 |
|
|
(0.026) |
(0.025) |
(0.026) |
(0.027) |
||
|
32,000 to 47,999 |
− 0.007 |
0.017 |
− 0.007 |
− 0.004 |
|
|
(0.025) |
(0.024) |
(0.025) |
(0.026) |
||
|
48,000 to 63,999 |
− 0.031 |
0.002 |
− 0.032 |
− 0.029 |
|
|
(0.030) |
(0.028) |
(0.030) |
(0.030) |
||
|
64,000 or more |
0.057** |
0.065** |
0.057** |
0.061** |
|
|
(0.029) |
(0.028) |
(0.029) |
(0.030) |
||
|
PNTD |
0.010 |
0.002 |
0.010 |
0.014 |
|
|
(0.035) |
(0.033) |
(0.035) |
(0.035) |
||
|
Constant |
0.917*** |
||||
|
(0.069) |
|||||
|
Number of participants |
586 |
586 |
718 |
586 |
586 |
|
Number of observations |
4688 |
4688 |
5744 |
4688 |
4688 |
|
FOSD violations |
No |
No |
Yes |
No |
No |
|
Period fixed-effects |
No |
Yes |
Yes |
Yes |
Yes |
|
Lottery fixed-effects |
No |
Yes |
Yes |
Yes |
Yes |

Significance codes: *
 **
**
 ***
***

Our regression analysis confirms our main findings from Sect. 4.2. The Merely-Chosen dummy in Model (1), taking value 1 if lottery a was merely-chosen, is insignificant. This dummy captures the grand difference between merely-chosen and merely-rejected a lotteries in our experiment. These results are robust with regard to preference-pair-specific features, period effects, demographic controls, and presentation controls, see Model (2). Demographic control variables were included for robustness purposes, but we had no specific hypotheses about them. We observe that women, students, and older participants tended to choose lottery a less often. Similarly, highly educated participants, participants not in full-time work, and participants belonging to the highest household income level tended to choose lottery a more frequently. We also found that lottery a was chosen more frequently when positioned on the right-hand side of the screen. Finally, Model (3) is equivalent to Model (2) in terms of specification, but includes participants who violate FOSD, with FOSD violations coded as the actual choice made in the mere-choice pair. We expected Model (3) to yield similar results as Model (2) for two reasons. First, we expected FOSD violation rates to be low, so their impact should be small. Second, the underlying theories on choice-induced-preference changes do not distinguish between correct and erroneous decisions. Incorrectly chosen (dominated) lotteries a should trigger the same preference change effects as correctly chosen (dominating) lotteries a. Model (3) broadly confirms our previous analysis and we do not find any trace of the mere-choice effect.
Model (4) controls for the decoy effect as explained in Sect. 3 of the paper. This models drops the Merely-Chosen dummy and replaces it with dummy variables representing different treatments. The comparison treatment is given by the non-star REJECT treatments. The CHOOSE dummy represents the non-junk CHOOSE treatments. The CHOOSE-JUNK and REJECT-STAR dummies take the value 1 if lottery c was a junk-type and star-type lottery, respectively. As can be seen in Table 3, the CHOOSE-JUNK and CHOOSE coefficients are insignificant. The mere choice effect was, hence, absent in our data independently of how we constructed lottery c. In the CHOOSE treatments, c was dominated by a, but not by b. In CHOOSE-JUNK, c was dominated by both a and b. There was, hence, no asymmetric dominance present in the latter observations and the decoy effect was shut down. Comparing the CHOOSE-JUNK and CHOOSE coefficients with a post-hoc hypothesis test, we find this difference to be insignificant. Absence of evidence for the decoy effect is likely due to our sequential presentation format. That is, the decoy effect emerges only when all three relevant choice options are presented simultaneously. We also observe that the REJECT-STAR dummy is not significant. With non-star REJECT treatments asymmetric dominance should impact the desirability of lottery c; c dominates a, but not b. Hence, no difference between the REJECT treatments was to be expected, since all choices in stage 2 were among (a, b), not involving c.
Model (5) controls for the difficulty of the decision. It is known from the literature that hard / difficult decisions, i.e., being close to indifference, typically generate more variability in choice, higher preference reversal rates, or stronger decoy effects (see, e.g., Moffatt, Reference Moffatt2005; Alós-Ferrer et al., Reference Alós-Ferrer, Granić, Kern and Wagner2016a; Agranov and Ortoleva, Reference Agranov and Ortoleva2017; Alós-Ferrer, Reference Alós-Ferrer2018; Alós-Ferrer and Garagnani, Reference Alós-Ferrer and Garagnani2018; Sürücü et al., Reference Sürücü, Djawadi and Recker2019; Alós-Ferrer and Garagnani, Reference Alós-Ferrer and Garagnani2021). It is plausible to assume that the preference increase resulting from mere choices has a natural, upper bound. In this case, the mere choice effect would be strongest if the decision maker is close to indifference in (a, b) decisions. That is, if ex ante a and b are similar in magnitude in terms of expected utilities, mere-choice-induced preference changes are more likely to tilt the decision in favor of target lottery a. We can classify the first four of our (a, b)-lottery pairs from Table 2 as hard / difficult decisions, because they involve a clear tradeoff. Lottery a has a higher expected value than b, but is more risky (the lower outcome has a larger probability). Analogously, we can classify the last four (a, b)-lottery pairs as easy decisions. There is no tradeoff in these pairs and the higher expected value lotteries a are relatively safe.Footnote 8 In easy decisions, lottery a is the favorite and we expect that a is chosen more frequently than b (>50%). In hard decisions we expect participants to be closer to indifference, with choice frequencies also closer to 50:50. To control for the difficulty of decisions, we have added a dummy variable in Model (5) that captures whether or not (a, b) were hard/difficult decisions. We have also included an interaction term between the Merely-Chosen dummy and the the HARD dummy to investigate if the mere choice effect depends on decision difficulty. We opted for a linear probability approach in Model (5), because it is impossible to estimate the marginal effect of an interaction term using probit. As expected, the HARD dummy was significant and negative. On average, the choice frequency for a was 26.6 percentage points lower in hard decisions than in easy ones, see also the right-hand panel in Fig. 2. We also observe that the interaction term is insignificant, providing evidence that the mere-choice effect was also absent in difficult decisions.
As a last robustness check, we have run additional linear probabilities models which we report in the Online Appendix. The aim of these models was to investigate if the manipulation domain (probabilities vs outcomes) to obtain FOSD relationships impacted the mere choice effect. The models included an interaction term between the Merely-Chosen dummy and a dummy capturing the probability domain. We find no evidence for such an effect and the estimated interaction coefficients were not significant.
Finally, we would like to note that, in general, an observed mere choice effect could have been a manifestation of the mere exposure effect, see also Sect. 2. The mere exposure effect is a general tendency in decision makers to develop a ‘preference’ for alternatives merely because they have been exposed to them (Zajonc, Reference Zajonc1968; Bornstein, Reference Bornstein1989; Monahan et al., Reference Monahan, Murphy and Zajonc2000; Zajonc, Reference Zajonc2001). To test for the mere exposure effect, we ran an additional baseline treatment with 120 participants. In this baseline treatment, participants made FOSD choices in stage 1 unrelated to the pairs (a, b). Stage 2 was identical to REJECT and CHOOSE. When making choices between (a, b) in stage 2, no participant was, hence, previously exposed to the a-type lotteries in the baseline treatment. In comparison to the baseline treatment, the mere exposure effect should increase the choice frequency for a in both CHOOSE and REJECT in stage 2. To facilitate comparison between treatments, we followed an analogous procedure as for our main tests and eliminated 25 participants who violated FOSD at least once with their stage-1 choices in the baseline treatment (the FOSD violation rate was 6.1% in this treatment). A Kruskal-Wallis test did not reveal any significant differences in the number of choices for a in (a, b) per participant between CHOOSE, REJECT, and the baseline treatment (
 ). We recorded on average 6.05, 6.02, and 6.06 choices for a-type lotteries in stage 2 in CHOOSE, REJECT, and baseline, respectively. That is, we find no trace of the mere exposure effect in our data.
5 Conclusion
Using a novel, parsimonious experimental design, we have presented the first conclusive evidence on the economic validity of the mere-choice-induced preference change phenomenon. We do not find any evidence which could be interpreted as mere-choice-induced preference change. Of course, absence of evidence is not evidence of absence, but, given the power analysis underlying our analysis, the simplest explanation for our results at this point is that mere-choice-induced preference change in economic domains does not exist or is of a negligible magnitude.
From predicting consumer behavior to cost-benefit analyses of medical treatments to welfare comparisons of alternative market institutions, many applications of standard theories of decision making under risk are built on the possibility to organize observed choices through underlying stable preferences. We have shown that the latter view seems appropriate with regard to mere-choice-induced preference changes.
Of course, as with any other experiment finding a null effect, it might still be the case that the alleged effect exists under some additional condition not fulfilled in our design. For instance, we have manipulated choice in lottery pairs by previous choices involving the riskier of the two lotteries in the pair, in the sense that the two monetary outcomes of that lottery are slightly more extreme than the ones of the alternative. However, as the mere-choice effect is understood in the literature, it should have been effective in our experiment, and additional conditions would come on top of received descriptions of the alleged effect.
We should also remark that we have studied the pure effect of uninformative choice on preference. A related stream of literature in psychology, which regrettably used a flawed design (see Alós-Ferrer and Shi, Reference Alós-Ferrer and Shi2015, for details), can be seen as incorporating some form of tradeoff in choice. If tradeoffs are a necessary precondition for the phenomenon to emerge then appropriate experimental designs will have to be developed, with an eye on separating this potential source from the pure effect of choice. At this point, however, we can conclude that the phenomenon of mere-choice-induced preference change is weak or nonexistent and, therefore, probably not very relevant in economically-relevant domains.
Funding
Open Access funding provided by Universität Zürich.
Declarations
Conflict of interest
The authors declare that they have no conflict of interest.


 N%
N% N%
N%

 1-p
1-p
 a,b
a,b a,b
a,b


 Open access