


1 Introduction
Cooperation among nonrelatives occurs frequently, for example among employees or users of a common pool resource. Stable cooperation often relies on actual or potential punishment of defectors. Punishment can take various forms, ranging from soft measures like disapproval to material measures like fines to harsh punishment like ostracism. Punishment may be assigned and enforced by an external authority, for example by the government or the employer, or it may be initiated and enforced within the community. Numerous studies in the lab and in various field contexts have shown that people are willing to punish defectors even at a personal cost (Ostrom Reference Ostrom1990; Chaudhuri Reference Chaudhuri2011).
In this paper, we investigate a particular form of punishment, namely ostracism, in an experimental setting. Ostracism refers to the general process of excluding individuals from a group. We know from previous experiments that the option to exclude other players increases cooperation similar to other forms of punishment (see the next section). Our main interest in this paper is on whether people choose ostracism as a punishment institution when they have the choice and how this decision affects cooperation as compared to an exogenously imposed institution.
Ostracism has been practiced in virtually all societies throughout all recorded history, from ancient Rome and medieval European kingdoms, to traditionalist communities like the Amish or clans in Tribal Montenegro (Boehm Reference Boehm1986; Gruter Reference Gruter1986; Zippelius Reference Zippelius1986; Gruter and Masters Reference Gruter and Masters1986). Imprisonment can be interpreted as modern version of ostracism executed by the government. Many groups that exist in modern democratic societies, like political parties, companies, or nonprofit associations, have rules that determine if and under what circumstances a member can be excluded. These exclusion rules may be implemented fully at the group’s own discretion or they may be restricted by superior regulations. For example, unions are typically not allowed to exclude individuals from the negotiated improvements of the working conditions (Traxler et al. Reference Traxler, Blaschke and Kittel2002). Political parties and nonprofit associations usually have discretion in using and determining exclusion rules and they often allow for exclusion if members violate important principles (Bolleyer and Gauja Reference Bolleyer and Gauja2015).Footnote 1 Users of common pool resources implement exclusion rules, among other things, to secure a sustainable use of the resource. For example, small villages in Switzerland and Japan have established rules for managing communal land as well as measures for violations of the rules including, as the ultimate punishment, banishment from the village (Ostrom Reference Ostrom1990). Microfinance groups whose members borrow under joint liability often exclude individuals who fail to repay the loan from social activities (Baland et al. Reference Baland, Gangadharan, Maitra and Somanathan2017; Putnam et al. Reference Putnam, Leonardi and Nanetti1994).
Unlike the deprivation or impairment of property (monetary punishment), ostracism necessarily is a collective decision as it requires some form of coordinated response by the community members. This can explain why it has been predominantly used for crimes that affected the community as a whole, such as cultic violations, arson, or high treason (Zippelius Reference Zippelius1986). The immediate consequence of excluding non-cooperative individuals is that the society becomes smaller. The indirect and longer-term consequence is that further decline of cooperation may be averted. Ostracism can be useful in supporting group cohesion but it can also hurt the community if too many or the wrong individuals are excluded (Gruter and Masters Reference Gruter and Masters1986). Even if ostracism is exclusively targeted at defectors, the unforgiving nature of the punishment may preclude potential rehabilitation and, together with the provisions that may be needed to separate the excluded members from the group, make the punishment overly expensive.
Despite the widespread incidence of ostracism in human societies around the world, the economics literature has devoted only little attention to the phenomenon, especially when compared to the study of monetary punishment, which has received considerable attention (Ostrom et al. Reference Ostrom, Walker and Gardner1992; Fehr and Gächter Reference Fehr and Gächter2000; for a review see Chaudhuri Reference Chaudhuri2011). In this paper, we use a repeated linear public goods game to study whether groups choose to implement an exclusion institution when they have a choice.Footnote 2 Depending on their choice, groups either have the option to exclude members over the course of the game or not. Excluding a player necessarily means that the social optimum is no longer available as the group loses a potential contributor. We distinguish between a costless exclusion institution and a costly exclusion institution which, if chosen, reduces the endowment of all players. If there is an institutional cost, then implementing the institution forecloses achievement of the social optimum even if no group member is excluded. With this design, we want to test whether groups choose to implement the exclusion institution, how this choice affects cooperation, and how a fixed institutional cost affects the decisions and outcomes. We also compare an exclusion institution that is endogenously chosen by the groups to one that is exogenously imposed to understand the robustness of the results with respect to how the institution is implemented.
The experimental design clearly represents a marked simplification of the institution formation process in the real world which usually is a slow process with gradual changes over time. In many of the above-mentioned examples of ostracism, especially those with a long history, it is impossible to say when exactly members agreed to use ostracism as a way to punish defectors. In some cases, exclusion might have started as an ad-hoc reaction by a few members of the society and then developed into a social norm or tradition without ever being openly discussed and democratically chosen. Nevertheless, at any given point in time, the preservation and functioning of an institution depend on an internal agreement of at least some of the society’s members. Curtailing the institution formation process into a limited number of decisions in a short period of time allows us to compare the performance of groups that implement the institution and groups that do not implement it, and to compare the behavior of the supporters and the opponents of the institution.
We find that a significant share of the experimental groups choose to implement the exclusion institution, even when it comes at a cost. Contributions to the public good are significantly higher when the exclusion option is available, not only because low contributors are excluded but also because high contributors sustain a higher cooperation level under the exclusion institution. Supporters of the institution contribute more than its opponents, but only when the institution is implemented. With respect to how the institution is implemented, we find that groups that choose the institution endogenously contribute slightly more than groups that are forced to play under the same institution. The differences, however, are small and not statistically significant.
These results are to a large extent inconsistent with the standard economics model based on purely selfish preferences which predicts that the threat of exclusion is not sufficient to support cooperation in a finitely repeated game. Given this inconsistency, we use two simple and well-established models to show that the results can be better explained by assuming social preferences. The inequality aversion model by Fehr and Schmidt (Reference Fehr and Schmidt1999) assumes that individuals dislike income differences between themselves and others. The reciprocity model by Rabin (Reference Rabin1993) assumes that individuals derive utility from repaying kindness with kindness and unkindness with unkindness. The two models make similar predictions for the choice of the institution and the experimental results closely resemble the predictions for heterogeneous groups in which the majority of players is social and the minority is selfish.
The remainder of the paper is structured as follows. Section 2 provides an overview of the previous literature on cooperation in finitely repeated games, the effects of punishment opportunities, and endogenous institutional choice. Section 3 describes our experimental design and Sect. 4 discusses the institutional choice based on standard economic theory and two models of social preferences. Section 5 presents the main experimental results (less important results are presented in an Appendix of ESM) and Sect. 6 discusses the results and concludes.
2 Previous experimental literature
Numerous public goods experiments have shown that an option to reduce other players’ payoffs increases contributions in public goods games (Fehr and Gächter Reference Fehr and Gächter2000; for a review see Chaudhuri Reference Chaudhuri2011). Despite higher contributions, however, overall payoffs do not necessarily increase due to the costs that occur on the side of the punishers and their targets. Clear payoff advantages are often realized only towards the end of the game or in games with long time horizons (Gächter et al. Reference Gächter, Renner and Sefton2008). Compared with monetary punishment, only few studies have investigated the effects of an exclusion institution. These studies typically include an additional stage after the contribution stage in which players are informed about individual contributions and then can vote to exclude one or more of the other players from the game for all or some of the remaining periods (Masclet Reference Masclet2003; Cinyabuguma et al. Reference Cinyabuguma, Page and Putterman2005; Maier-Rigaud et al. Reference Maier-Rigaud, Martinsson and Staffiero2010; Akpalu and Martinsson Reference Akpalu and Martinsson2011).Footnote 3 These studies show that subjects use the exclusion option to exclude low contributors from the group and sustain high levels of cooperation among the remaining players. Feinberg et al. (Reference Feinberg, Willer and Schultz2014) show that cooperators also exclude low contributors from the group when this information is not based on their own experience but on a “gossip” note from the co-players of that low contributor in a previous game. Davis and Johnson (Reference Davis and Johnson2015) study an institution in which players cannot exclude others from the benefits of cooperation but from an accompanying social activity, namely chatting with the other players. They find that players use this exclusion mechanism to punish free-riders but the overall effect of this rather soft exclusion mechanism on cooperation is small.
A number of related studies do not look at exclusion of individual players but more broadly at sorting mechanisms that allow players to influence with whom they are playing, for instance, by letting them choose the group, switch between groups, or form new groups (Ehrhart and Keser Reference Ehrhart and Keser1999; Page et al. Reference Page, Putterman and Unel2005; Brekke et al. Reference Brekke, Hauge, Lind and Nyborg2011; Charness and Yang Reference Charness and Yang2014). These experiments show that, if the available sorting mechanism allows conditional cooperators to separate themselves from the free-riders, they often achieve much higher cooperation rates than in fixed groups and also provide an incentive for the free-riders to change their strategy.
Recent studies on endogenous institutional choice investigate if subjects can anticipate the positive effect of punishment on cooperation and vote in favor of a punishment institution when they have the choice (for a review, see Dannenberg and Gallier Reference Dannenberg and Gallier2019). A general result of this literature is that subjects initially are reluctant to vote for a punishment institution but learn to use it as an enforcement mechanism over time. It seems necessary, however, that imposing punishments on others is not too expensive, that voters get sufficient feedback on behavior under the different institutions, and that they can vote repeatedly (e.g. Gürerk et al. Reference Gürerk, Irlenbusch and Rockenbach2006; Ertan et al. Reference Ertan, Page and Putterman2009; Sutter et al. Reference Sutter, Haigner and Kocher2010). Strong institutions that change the nature of the cooperation game by making full cooperation one or the unique equilibrium of the game often have large effects on cooperation and are supported by many voters, at least after some rounds of learning (e.g. Tyran and Feld Reference Tyran and Feld2006; Dal Bó et al. Reference Dal Bó, Foster and Putterman2010, Reference Dal Bó, Dal Bó and Eyster2018). But also weak institutions that do not change the nature of the game can have significant effects on cooperation and be quite popular (Feld and Tyran Reference Feld and Tyran2002; Fehr and Williams Reference Fehr and Williams2017). Institutional costs often reduce the support even though costly institutions may still be worthwhile implementing (Markussen et al. Reference Markussen, Putterman and Tyran2014; Barrett and Dannenberg Reference Barrett and Dannenberg2017).
To the best of our knowledge, it has not yet been studied how players vote when the choice is between a standard public goods game and a game with an exclusion option. In the experiment by Solda and Villeval (Reference Solda and Villeval2018), the exclusion institution itself is exogenously imposed but players can vote to decide who will be excluded and for how long. They find that free-riders, and in particular those who deviate considerably and repeatedly from the group average, are excluded more often and for a longer period than others.
The literature on endogenous institutions also tries to answer the question if endogenously implemented institutions have different effects on behavior than exogenously imposed institutions. A relatively robust result is that groups that implement an institution endogenously have higher cooperation rates than groups that are forced to play under the same institution. This difference tends to be small for strong institutions that change the equilibrium of the game, simply because strong institutions have a large effect on cooperation irrespective of how they are implemented. By contrast, the difference can be quite large for weak institutions that do not change the equilibrium (Dannenberg and Gallier Reference Dannenberg and Gallier2019). We contribute to this literature by comparing the effects of an exclusion institution that is endogenously chosen and one that is exogenously imposed. This comparison has not been provided yet and it is interesting as the exclusion institution is weak from a theoretical perspective but it may be perceived as a relatively strong institution by the players.
3 Experimental design
3.1 The public goods games
Our experiment on endogenous institutions involves choosing between and playing different public goods games. The choice is always between a standard public goods game and a public goods game with an option to exclude members from the group. Participants are divided into groups of
 members that remain fixed throughout the experiment (partner design).Footnote 4 There are four phases which consist of five rounds each, with the game being fixed within a phase. In every round, groups of size
 play a public goods game and every player
 receives an endowment
 of which he or she can contribute to the public good. Player
 contribution is denoted by
 . The stage game payoff to player
 is given by
 and the marginal per capita return (MPCR) is
 .
.
In every round, players choose simultaneously how much to contribute to the public good. After each round, individual contributions are displayed on the screen in random order, so that it is not possible to track the contribution by other members over time. This ensures that the decision to vote for the exclusion of a player in a given round is not based on the player’s reputation formed in the course of the game, but only on his or her contribution in that round.
To study endogenous institutional choice, we distinguish between three versions of the public goods game which are denoted by
 . In game A, players’ endowment is
 . This game does not allow players to exclude other members from the group so that the group size is fixed at
 in all rounds. In game B10, players’ endowment is the same as in game A with
 , whereas in game B8, it is reduced by 20% to
 . Both games, B10 and B8, allow players to exclude members from the group so that
 . For this purpose, these games include an additional stage. After having been informed about the individual contributions, players can vote to exclude a member from the group. Next to each contribution, an empty box is shown on the screen which players can tick in order to vote for that player to be excluded. The players are informed about the number of votes they have received but not from whom. Thus, while blind revenge against the group is possible, targeted retaliation after exclusion is not. Each player can cast at most one vote, at no cost, in order to determine who should be excluded. Players cannot vote for themselves but they can decide not to vote at all. Players who receive the votes from more than half of his or her co-players will be excluded from the game for the remaining rounds in that phase. This implies that the group can shrink over time. If the group consists of five members, a player must receive at least three votes in order to be excluded. If the group consists of three or four members, a player must receive at least two votes in order to be excluded. If the group consists of only two members, exclusion is no longer possible. With these voting rules, it is possible but unlikely that two players are excluded from the group at the same time. The only case in which two players could be excluded at the same time is when there are four players and two of them receive exactly two votes. The excluded players receive the endowment, either
 or
or
 , in each round but they are no longer able to contribute to and benefit from the public good. They are able to observe what happens in the public goods game but they are no longer allowed to vote for other players to be excluded.Footnote 5 There is no exclusion stage in the last round of a phase. To exclude the ostracized players from the benefits of the public good but not from getting their endowment is a relatively conservative approach. It can be interpreted that the community has the power to exclude individuals from the social benefits but not to take away their source of livelihood.
3.2 Main treatments
At the start of each phase, the full group, consisting of
 members, chooses the game they want to play, with simple majority deciding. Importantly, the choice is always between the A game and one of the two B games (and never between the two B games). In the treatment called “B10,” players choose between A and B10, while in the treatment called “B8,” players choose between A and B8.Footnote 6 The reduced endowment in B8 compared to game A can be interpreted as a collective cost of the exclusion option. We set the fixed cost of the institution to 20% of the endowment, so that it would be challenging but not impossible to compensate for the cost through higher contributions in the B8 game. All members of the group simultaneously vote either for game A or for game B. There are no abstentions. For a game to be selected, at least three out of the five members must vote for that game. Members are informed about which game has been selected, but not about the individual votes. Afterwards, the group plays the chosen game throughout that phase. If the group plays B10 or B8 and a player gets excluded from the group, the exclusion lasts only until the end of the respective phase. At the beginning of the new phase, the excluded player re-enters the group and all players vote again to choose between game A and game B. Figure 1 presents the time line in the experiment.
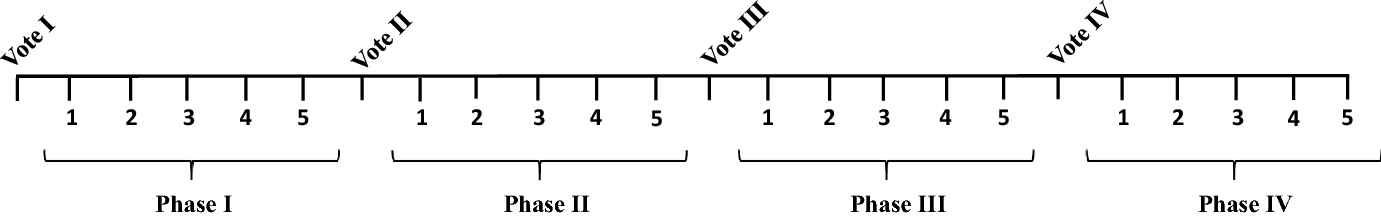
Fig. 1 Voting rounds and phases
A few things about our design are worth noting. First, players can abstain from the exclusion vote but not from the vote on the institution. There are several reasons for this. The nature of our research question, which is endogenous institutional choice and its consequences, requires an active game choice by the participants. Allowing for abstention from the institutional vote would have introduced behavioral issues out of our control. For example, playing game B would not necessarily imply that the majority has voted in favor of B. Another reason is to avoid practical inconvenience. Assume that all five players abstain from voting or there is a tie. A random device would have been needed then to determine which game is played, since one of the two games must be played. In this situation, the institutional choice would not have been endogenous. In the case of the exclusion vote these factors are less of an issue. The option to abstain is necessary here for situations in which all group members make equally high (or low) contributions. Second, given the MPCR of
 , contributing to the public good is inefficient once the group has shrunk to just two members. In this case, the collective benefit of contributing one unit to the public good is smaller than the cost (
 ). This could have been avoided by a higher MPCR. If, for example, the MPCR was increased to 0.6, contributing to the public good would be efficient even with two players only. However, in the initial group of five players, the full cooperative payoff would then be three times as large as the Nash payoff and thus create strong incentives to cooperate even without the exclusion institution. Alternatively, we could have restricted the voting rule in the B games by capping the number of excludable players at two but this would have facilitated the institutional choice between game A and game B. In our design, if players choose the B game their challenge is to maintain both a high cooperation level and a large enough group. Third, our groups start the experiment by choosing between the games with no prior experience. Therefore, all learning is endogenous as it depends on how groups choose and play over the course of the experiment. Experience has been shown to be critical for institutional choice, so a natural extension of our study would be to have subjects gain some experience in one or both games before they choose between them (Markussen et al. Reference Markussen, Putterman and Tyran2014; Barrett and Dannenberg Reference Barrett and Dannenberg2017).
3.3 Exogenous control treatments
With endogenous choice of the institution, where groups select themselves into the different games, it is not clear if the institution is successful because it attracts the most cooperative groups or because the institution changes the incentives to cooperate, regardless of whether the groups are particularly cooperative or not. In order to distinguish between the effect of self-selection and the effect of the institution, we conducted two additional treatments, B10-exo and B8-exo, in which groups played games A and B over the same number of rounds but, unlike the groups in the endogenous treatments, these groups could not vote on the two games but had to play the game that was announced by the computer.Footnote 7 For each group in the endogenous treatments, we had one group in the exogenous treatments that played the exact same sequence of A games and B games (perfect matching groups). This means that, in each phase, the distribution of groups between the two games in the exogenous treatments is identical to the distribution in the corresponding endogenous treatment. To keep the difference to the endogenous treatments to a minimum, players in the exogenous treatments were not informed about the sequence in advance but learned which game they would play only at the beginning of each phase. Apart from the missing voting stage and the way the games were chosen, everything in the exogenous treatments was identical to the endogenous treatments. The exogenous treatments also allow us to compare the results with the previous literature.
3.4 Implementation
The experimental sessions were held in a computer lab at the University of Magdeburg, Germany, using undergraduate students recruited from the general student population. In total, 460 students participated in the experiment with each one taking part in one treatment only (between-subject design). For our main treatments, we conducted eight sessions in June 2016 and assigned them randomly to B10 and B8.Footnote 8 For the exogenous control treatments, we conducted ten sessions in September and November 2018 at the same computer lab and assigned them randomly to B10-exo and B8-exo.Footnote 9 For each of the four treatments, we had 23 groups that consisted of five players each. In each session, subjects were seated at linked computers (game software z-Ttree; Fischbacher Reference Fischbacher2007) and randomly divided into five-person groups. Subjects did not know the identities of their co-players, but they did know that the membership of their group remained unchanged throughout the session. The experimental instructions were handed out to the students and also read aloud to ensure common knowledge. They carefully explained both games, A and B, and included several numerical examples. Before subjects began playing the games, they had to answer a number of control questions. The control questions tested subjects’ understanding of the games to ensure that they were aware of the available strategies and the implications of making different choices. The experiment began only when all participants had answered the control questions correctly. Questions during this process were answered privately. During the game, earnings were displayed in tokens. It was public knowledge that payments would be calculated by summing up the number of tokens earned over all rounds and by applying an exchange rate of €.05 per token. At the end of the experiment, subjects were paid their earnings privately in cash.
4 Theoretical background
In this section we derive the equilibria of games A and B, using standard preferences and two models of social preferences. For each model, we provide predictions for players’ choice between the games, assuming common knowledge of preferences throughout. For brevity we present only a summary of the main results, while the complete analysis with the proofs can be found in Appendix A of ESM.
4.1 Standard preferences model
In the standard preferences model, zero contribution by all players is the unique Nash equilibrium (NE) of the stage game. This equilibrium is Pareto dominated by the outcome in which all players contribute their entire endowment as long as the group has more than two members. By backward induction it obtains that the unique subgame perfect Nash equilibrium (SPNE) of the repeated game is zero contribution by all players in each round, regardless of the game played. Thus, players are indifferent between game A and game B10, but prefer A to B8 as the former gives a higher endowment and so a higher payoff. Hence, the standard preferences model predicts that game B8 is never played when the choice is between A and B8. When the choice is between A and B10, each game will be played half the time. If B10 is chosen, then any configuration of votes and group sizes can be part of an equilibrium because exclusion in our setting is costless and players are thus indifferent between excluding and not excluding a group member (see Appendix A.1 of ESM).
4.2 Inequality aversion model
In the inequality aversion model by Fehr and Schmidt (Reference Fehr and Schmidt1999), players derive utility from the material earnings resulting from the public good, and they derive disutility if their earnings are higher than those of other group members (advantageous inequality aversion) or if their earnings are lower than those of other group members (disadvantageous inequality aversion). Specifically, the inequality averse utility function is:

where
 is player
 material payoff from the public good,
 measures the aversion to disadvantageous inequality and
 captures the aversion to advantageous inequality. Moreover,
 such that players are more averse to disadvantageous than to advantageous inequality.
With these preferences, any weakly positive contribution level
 for all i, can be supported as an equilibrium of the stage game if all group members are sufficiently averse to advantageous inequality, i.e.
 . We call these players conditional cooperators, following the original paper. This equilibrium exists in both games and it makes no use of the exclusion option in game B. However, it requires coordination on a certain contribution level for which full contributions seems to be a natural focal point as it is Pareto dominant. By backward induction it obtains that full contributions in each round is a SPNE, regardless of the game played. Since the exclusion option in game B is not used, the choice between the games is governed by the contribution level on which players coordinate in each game. If there is coordination on the same contribution level across the games, then groups of inequality averse players are indifferent between playing A and playing B10, but they strictly prefer A to B8 (see Appendix A.2 of ESM).
With one selfish player in the group, with
 , the unique equilibrium of the stage game is zero contribution by all players, since this strategy is dominant for the selfish player.Footnote 10 Given this, it is also the best response of the remaining conditionally cooperative players, i.e. those players for which
 .Footnote 11 However, in game B, the conditional cooperators can use the exclusion institution against the selfish player. It can be shown that, although in the first round all players contribute zero due to the presence of the selfish player, the conditional cooperators exclude her after this round and cooperation is restored for the remaining rounds of play. Because exclusion is not possible in game A, the only SPNE of game A is zero contribution by all players in every round. Given these equilibrium outcomes, the selfish player either strictly prefers game A over both B8 and B10 (if
 ) or she prefers A over B8 and is indifferent between A and B10 (if
 ).Footnote 12 The conditional cooperators strictly prefer B10 to A and they prefer B8 to A if they coordinate on a high enough contribution level after excluding the selfish player. With our experimental parameters, these players should contribute more than 5 tokens for game B8 to be preferred (see Appendix A.2 of ESM).Footnote 13
4.3 Reciprocity model
The reciprocity model of Rabin (Reference Rabin1993) assumes that people derive utility from reciprocation of kindness and unkindness, in addition to the monetary gains. We base our analysis on the multi-player extension of this model by Nyborg (Reference Nyborg2017) and define the reciprocal utility as

where
 is the material payoff from the public good,
 is the weight attributed to reciprocation, and R
i is the reciprocation term. We use the same measure of kindness as in Nyborg (Reference Nyborg2017) and define the reciprocation term as:
is the weight attributed to reciprocation, and R
i is the reciprocation term. We use the same measure of kindness as in Nyborg (Reference Nyborg2017) and define the reciprocation term as:
where
 is the kindness of player
 towards player
 and
and
 is
is
 belief about the kindness of
 towards
 If all players have a sufficiently high concern for reciprocation, i.e.
 then the stage game has two pure-strategy NE, one in which all players contribute zero and one in which all players contribute their full endowment. For the SPNE, in which either of the stage-game equilibria is repeated every round, the symmetry of the equilibrium leaves the exclusion institution in game B unused (or ineffective if used in the zero-contribution equilibrium). Hence, groups of highly reciprocal players are indifferent between A and B10, but prefer A to B8 due to the higher endowment (see Appendix A.3 of ESM). If players are not sufficiently reciprocal, i.e.
 then zero contribution by all players is the only equilibrium.
When there is one non-reciprocal player with
 but
but
 the stage game again has two pure-strategy NE. The non-reciprocal player contributes zero, regardless of what the reciprocal players do. Apart from the equilibrium in which all players contribute zero, there is a pure-strategy equilibrium in which the reciprocal players contribute their full endowment, but only if they are highly reciprocal, i.e.
 . These two types of equilibria exist both in game A and in game B. Therefore, the repetition of either of the two pure-strategy NE is a SPNE of game A. However, in game B, the SPNE that involves the full-contribution equilibrium by the highly reciprocal players in all rounds includes the exclusion of the non-reciprocal player after the first round. If the reciprocal players are only moderately reciprocal, i.e.
 , then in game B there is yet a third SPNE in which all players contribute zero in the first round, the reciprocal players exclude the non-reciprocal player after this round and contribute their full endowments thereafter.
For the choice between the games we assume that the reciprocal players play consistently across the two games either the zero- or the full-contribution equilibrium, when they exist in both games. If the zero-contribution equilibrium is played, then players are indifferent between B10 and A, but strictly prefer A to B8. If the full-contribution equilibrium is played, then both game B10 and game B8 are preferred by the reciprocal players. Even if the reciprocal players are only moderately reciprocal they prefer B10 and B8 to game A and use the exclusion institution. The non-reciprocal player strictly prefers game A over B10 and B8, since game A allows her to benefit from the public good while defecting in all rounds (see Appendix A.3 of ESM).
4.4 Differences between standard and social preferences
In summary, in the standard preferences model, the exclusion institution does not change the zero-contribution equilibrium, as the threat of exclusion is not sufficient to sustain cooperation. When social preferences are assumed, the composition of the group and the ability of the social players (with strong preferences for equality or reciprocity) to coordinate towards the Pareto-superior equilibrium are crucial for the game choice. Groups consisting solely of social individuals can sustain cooperation in both games. If at all, they choose the exclusion institution only if it is costless and they do not use it in equilibrium. If there is a selfish player in the group who does not care much about equality or reciprocity and if the social players coordinate successfully, they implement the exclusion institution, exclude the selfish player from the group, and cooperate thereafter. With some restrictions, this is also true when the exclusion institution is costly. While it is not our intention to test the two theories of social preferences with this experiment, as has been done for example by Blanco et al. (Reference Blanco, Engelmann and Normann2011), we use them to provide possible explanations for why players may vote for and use the exclusion institution.
5 Results
We first describe how individuals voted between the two games in the endogenous treatments and how they performed depending on their choice of the game. We then describe the behavior of the players in the exogenous treatments and how it compares to the endogenous case. To keep the focus on institutional choice and its effects on cooperation, additional results are presented in the Appendix B of ESM.
5.1 Voting behavior and game choice
Figure 2 shows how individuals vote over the four phases, how many groups play game A, the standard game without exclusion option, and how many groups play game B, the game with exclusion option, in each phase. The majority of individuals votes for game A in the first phase in both treatments, with the majority being particularly large when game B has a lower endowment (B8) than game A. However, the share of individuals who vote for B increases over the course of the four phases. The increase in votes for B is the largest from the first to the second phase and becomes smaller in later phases. The support for game B also increases when it has a lower endowment, but at a lower level. In the B10 treatment, the share of B-voters increases from 37% in the first phase to 80% in the last phase and the share of groups that play B rises from 30% to 96%. In B8, the share of B-voters increases from 16% to 49% and the share of groups that play B increases from 4% to 52%. In each phase, groups are more likely to play game B in B10 than in B8 (Fisher’s Exact test, p < 0.05 for each phase).Footnote 14

Fig. 2 Voting behavior and game choice by treatment
A closer look at the individual voting behavior shows that most individuals do not move back and forth between voting for A and voting for B, but vote relatively consistently. In both treatments, 83% of the individuals who start the first phase by voting for game A either keep voting for A until the end or switch to B at some point and then keep voting for B. In the B10 treatment, 91% of the individuals who first vote for game B never switch to A. In the B8 treatment, where game B is costly, a relatively large share of 56% consistently votes for B without switching to A. Likewise, at the group level, 75% of groups in B10 and 68% of groups in B8 that start the first phase by playing A either keep playing A or switch to B at some point without switching back. The groups that start by playing B never switch to A.
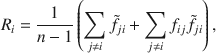
Table 1 shows regression results on the probability of voting for game B, conditional on treatment and the game played by the group in the previous phase. The best predictor of whether an individual votes for game A or game B is the voting decision in the previous phase, confirming that the preferences for the games are relatively stable over time. Another predictor is the payoff in game A when game A was played in the previous phase. The higher an individual’s payoff in game A, the less likely this person is to vote for game B in the next phase. These results show that, unlike in theory where we assume common knowledge of preferences, players in the experiment must first learn about their co-players’ preferences and then adjust their institutional choice accordingly. Despite the need to learn, the stability of the voting decisions over time is remarkable and thus consistent with the theory.
Table 1 Probability of voting for game B
|
B10 |
B8 |
|||
|---|---|---|---|---|
|
(1) |
(2) |
(3) |
(4) |
|
|
Previous game |
Game A |
Game B |
Game A |
Game B |
|
Voted for game B in previous phase (d) |
0.3343*** |
0.5578*** |
0.3852*** |
0.5147*** |
|
(0.0698) |
(0.0738) |
(0.1180) |
(0.1430) |
|
|
Average payoff in previous phase |
− 0.0276** |
− 0.0457*** |
||
|
(0.0134) |
(0.0080) |
|||
|
for previously non-excluded subjects |
0.1277 |
0.0560* |
||
|
(0.0113) |
(0.0303) |
|||
|
for previously excluded subjects |
− 0.0033 |
− 0.0537 |
||
|
(0.0184) |
(0.0525) |
|||
|
Average contribution (%) in previous phase |
0.3121** |
− 0.1332 |
||
|
(0.1575) |
(0.1031) |
|||
|
for previously non-excluded subjects |
0.3374* |
− 0.5370 |
||
|
(0.1888) |
(0.3880) |
|||
|
for previously excluded subjects |
0.1615 |
0.0396 |
||
|
(0.1575) |
(0.3839) |
|||
|
Excluded in previous phase (d) |
− .0359 |
0.0130 |
||
|
(0.0665) |
(0.1223) |
|||
|
Observations |
125 |
220 |
250 |
95 |
Average marginal effects (discrete effects for binary variables) from random effects probit estimations [pooled binary probit estimations in column (2)] with standard errors in parentheses. Standard errors clustered by group
Level of significance: *p < 0.10, **p < 0.05, ***p < 0.01
Dependent variable is the probability of voting for game B. When game B was played in the previous phase, regressions include interaction terms between average payoff in previous phase and excluded in previous phase as well as between average contribution in previous phase and excluded in previous phase. Dummy indicators for phases are included. (d) indicates dummy variable
5.2 Contributions
Table 2 gives an overview of average contributions, measured as percent of endowment, and average payoffs conditional on treatment, phase, and game. Contributions are substantially higher in game B than in game A, irrespective of treatment or phase. In B10, the average contribution across all phases is 41% in game A and 76% in game B. In B8, the average contribution is 41% in game A and 74% in game B. The differences in contributions between game A and game B within each treatment and phase are almost always statistically significant (Mann–Whitney–Wilcoxon (MWW) test, p < 0.05 for each treatment and phase, except phase II in B10 where p = 0.1009).
Table 2 Average contributions and payoffs by treatment, phase, and game

|
B10 |
B8 |
||||||||||
|---|---|---|---|---|---|---|---|---|---|---|---|
|
Phase |
Game |
Number of groups in each game |
Average group size |
Average contribution (in %) |
Average payoff (insider) |
Average payoff (all) |
Number of groups in each game |
Average group size |
Average contribution (in %) |
Average payoff (insider) |
Average payoff (all) |
|
I |
A |
16 |
5 |
45.82 |
14.6 |
14.6 |
22 |
5 |
49.78 |
15.0 |
15.0 |
|
B |
7 |
4.6 |
83.14*** |
17.4** |
17.1* |
1 |
4.6 |
93.00a |
14.5a |
14.0a |
|
|
II |
A |
5 |
5 |
41.68 |
14.2 |
14.2 |
14 |
5 |
44.20 |
14.4 |
14.4 |
|
B |
18 |
4.3 |
75.91 |
16.4 |
15.8 |
9 |
4.3 |
82.51*** |
13.1 |
12.6 |
|
|
III |
A |
4 |
5 |
24.20 |
12.4 |
12.4 |
14 |
5 |
40.89 |
14.1 |
14.1 |
|
B |
19 |
4.5 |
76.19a |
16.9a |
16.4a |
9 |
4.5 |
71.79*** |
13.1 |
12.8 |
|
|
IV |
A |
1 |
5 |
11.20 |
11.1 |
11.1 |
11 |
5 |
35.85 |
13.6 |
13.6 |
|
B |
22 |
4.5 |
72.42a |
16.5a |
16.0a |
12 |
4.5 |
66.22*** |
13.1 |
12.6 |
|
|
All |
A |
5 |
41.1 |
14.1 |
14.1 |
5 |
40.71 |
14.1 |
14.1 |
||
|
B |
4.3 |
75.69*** |
16.3*** |
15.7* |
4.3 |
74.00*** |
12.9* |
12.4*** |
|||
The table shows average contributions (in percent of endowment) and payoffs conditional on treatment, phase, and game. Stars indicate statistically significant differences between groups playing game A or game B within the same treatment and phase, using a two-sided MWW test and the group average per phase as unit of observation. In the bottom two lines (“All”), stars indicate statistically significant differences within groups when they play A or B in different phases, using a Wilcoxon signed-rank test and the group’s average contribution/payoff in either game across all rounds. Groups that play either A or B in all rounds are left out
Level of significance: *p < 0.10, **p < 0.05, ***p < 0.01
aIndicates that the number of observations is too low to run a test (N < 5)
Figure 3 shows how average contributions develop over time conditional on treatment and game. We see a strong end-of-phase effect in game B where the threat of exclusion dissolves and contributions drop to a similarly low level as in game A. This drop indicates that the learning process and the exclusions over the course of the game do not completely eliminate the uncertainty about the other players’ preferences and the remaining players do not want to risk a too high contribution without the threat of exclusion.

Fig. 3 Average contributions over time by treatment. The figure shows average contributions over time, measured in percent of endowment, in game A (blue) and in game B (red) by treatment. The dashed lines indicate that data points are based on only few observations (N < 5). Excluded players in game B are omitted. The lines thus represent the average efficiency level where efficiency is defined as the maximum payoff possible given the size of the groups. The bars depict average group size for groups playing game B in the respective phase
Of course, higher average contributions in game B could simply result from the exclusion of low contributors. To test if the exclusions alone account for the differences between game A and game B, we compare the contributions provided by the highest contributors between the two games by leaving out the excluded players in game B and the lowest contributors in game A.Footnote 15 The contributions of the remaining players are significantly higher in game B than in game A, irrespective of treatment and phase (see Appendix Table B.1 and Figure B.1 of ESM). Thus, the exclusion of low contributors alone cannot explain the higher average contributions in game B.
5.3 Difference between A-voters and B-voters
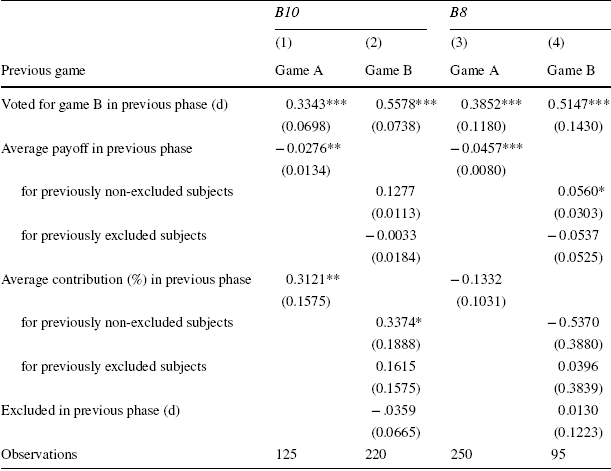
In order to test if there are behavioral differences between individuals who vote for game A and individuals who vote for game B, we investigate if and how the voting decision affects the contribution decision in the same phase. We start by comparing the contribution decisions of A-voters and B-voters when they play game B for the very first time. In the B10 treatment, A-voters contribute on average 59% in the first round of playing game B while B-voters contribute 83% in the first round. In B8, A-voters contribute on average 63% in the first round while B-voters contribute 87%. Table 3 provides the corresponding regression results on the differences between A-voters and B-voters when they play game B for the first time [columns (1) to (4)]. The results show that having voted for game B significantly increases first round contributions in both treatments. Additional regression results, shown in the Appendix of ESM (Table B.2), show that A-voters and B-voters do not only behave differently in the first round of playing game B, but also on average in the first phase of playing game B.
Table 3 First round contributions in game B
|
Game B is played for the first time |
Game B is not played for the first time |
|||||||
|---|---|---|---|---|---|---|---|---|
|
(1) B10 |
(2) B10 |
(3) B8 |
(4) B8 |
(5) B10 |
(6) B10 |
(7) B8 |
(8) B8 |
|
|
Voted for game B (d) |
0.2294*** |
0.2341** |
0.2509** |
0.2555** |
0.0561*** |
0.0396* |
0.0817 |
0.0565 |
|
(0.0651) |
(0.0915) |
(0.0952) |
(0.0928) |
(0.0217) |
(0.0204) |
(0.0747) |
(0.0652) |
|
|
Average contribution (%) in previous phase |
0.3874*** |
0.5416*** |
0.1320* |
0.2285 |
||||
|
(0.1118) |
(0.0832) |
(0.0702) |
(0.1468) |
|||||
|
Game B in previous phase (d) |
0.0495 |
− 0.1431 |
||||||
|
(0.0770) |
(0.1269) |
|||||||
|
Observations |
115 |
80 |
75 |
70 |
215 |
215 |
80 |
80 |
OLS estimation results [Columns (1)–(4)] and random effects GLS estimation results [Columns (5)–(8)] with standard errors in parentheses. Standard errors are clustered by group. Dependent variable is the individual contribution as percentage of endowment in game B
Level of significance: *p < 0.10, **p < 0.05, ***p < 0.01
Columns (5)–(8) exclude the first phase. Regressions include dummy indicators for phases. (d) indicates dummy variable
Columns (5)–(8) in Table 3 show the differences between A-voters and B-voters when game B is played for the second, third, or fourth time. We see that having voted for B in these cases has a smaller and often insignificant effect on contributions, indicating that the differences between A-voters and B-voters wear off when they gain experience with the B game.
We ask next if A-voters and B-voters also behave differently in game A, especially at the beginning when they have not yet gained any experience. In B10, when subjects play game A for the first time, A-voters contribute 56% in the first round while B-voters contribute 61% in the first round. In B8, A-voters contribute 66% in the first round and B-voters contribute 64%. The corresponding regression analyses on the differences between A-voters and B-voters in game A show that the voting decision only rarely affects contribution decisions in game A. Due to the mostly insignificant results, these regressions are shown in the Appendix of ESM (Tables B.3 and B.4). The regressions shown in Table 3 and in the Appendix of ESM also show that, in all treatments and games, a player’s average contribution in the previous phase predicts the contribution in the current phase, indicating a relatively consistent contribution pattern over time.
5.4 Group size and exclusion of players
While the group size is fixed in game A, it is possible for groups to shrink to a minimum of two players in game B. The average group size in game B across all rounds and phases is 4.3 and the average group size at the end of a phase is 3.8 in both treatments. In the B10 treatment, on average across all phases, 24% of groups keep a group size of five throughout the phase, 47% reach a group size of four, 17% a group size of three, and 12% a group size of two. The respective numbers for the B8 treatment are 26, 42, 23, and 10%.
Groups that do not exclude any members in game B attain very high contribution levels, which suggests that these groups happen to consist of conditional cooperators or that the mere threat of exclusion is sufficient to keep cooperation up. Groups that play game B and do exclude one or more members still achieve higher average contribution levels than groups that play game A.
The analysis of the voting decisions to exclude other players shows that many players receive a vote during the course of the game, but a much smaller share is actually excluded. Of the subjects who play game B at least once, 71% in B10 and 76% in B8 receive at least one vote for their exclusion. Forty-seven percent in B10 and 37% in B8 are excluded at least once over the course of the experiment. In both treatments, even though high and average contributors receive some votes, only the lowest contributors are excluded from the group. Thus, the exclusion option is used very effectively and no “anti-social” punishment occurs. Comparing the contribution behavior in game B, before and after the exclusion, we find that previously excluded subjects adapt their contribution levels in the direction of the others’ average, but they still contribute less than the others. Over the same phases, non-excluded subjects keep their relative contribution levels constant and very close to the average of the others. The adjustment of the excluded players appears to be perceived as insufficient. In both treatments, we find that previously excluded individuals face a significantly higher likelihood of being excluded (again) than individuals who have not been excluded before (see Appendix Tables B.5 and B.6 of ESM). Note that repeated exclusion cannot occur due to bad reputation as the contribution decisions are shown in random order in each round.
Players who receive a vote from their co-players but are not excluded can still perceive this as a warning that their contribution has been inadequate. Comparing contribution behavior before and after receiving a vote, we find that subjects who contribute less than the average of the others and who receive a vote but are not excluded adapt their contribution level in the direction of the others’ average in the next round of the same phase. This is also the case for low contributors who do not receive a vote for their exclusion—but their adjustment is smaller (see Appendix Table B.7 of ESM).
5.5 Payoffs
We have already established that, in both treatments, contributions in game B are significantly higher than in game A. However, this does not necessarily mean that payoffs are higher as well since the number of potential contributors in game B is lower and, in the B8 treatment, the endowment is lower. Across all phases, we see that game B leads to slightly higher payoffs when there is no institutional cost and it leads to slightly lower payoffs when there is an institutional cost. In B10, the average payoff in game A is 14 tokens and the average payoff in game B is 16 tokens. In B8, the average payoff in game A is 14 tokens and the average payoff in game B is 12 tokens.
Table 2 (and Figure B.2 in the Appendix of ESM) show that, in B10, average payoffs in all phases are higher in game B than in game A and the difference is statistically significant in phase I (MWW test, p < 0.1). In treatment B8, average payoffs are lower in game B than in game A in all phases, but the differences are never statistically significant. Table B.8 in the Appendix of ESM shows that, when we compare only the highest contributors (the non-excluded players in game B and the highest contributors in game A), average payoffs are always higher in game B than in game A when there is no institutional cost, with the difference being statistically significant in phase I (MWW test, p < 0.05). When there is an institutional cost, the high contributors’ average payoffs are lower in game B than in game A, but the difference is not statistically significant.
5.6 Comparison between endogenously chosen and exogenously imposed ostracism institution
Figure 4 provides a comparison of contribution rates in the two games between the endogenous treatments, B10 and B8, and the corresponding exogenous treatments, B10-exo and B8-exo. It shows that contribution rates are very similar in the endogenous treatments and the exogenous treatments. Contributions in the B game are slightly higher in the endogenous treatments than in the exogenous treatments in both B10 and B8. The same is true for the A game but only in the B8 treatment. There is no clear tendency in the B10 treatment. All these differences between endogenous and exogenous are very small and not statistically significant (MWW test, p > 0.1 each). Everything we have observed for the endogenous treatments also happens in the exogenous treatments: Contributions in the B game are significantly higher than in the A game and this is true for both B10-exo and B8-exo (MWW test, p < 0.05 for each treatment and phase, except phase I in B10-exo where p = 0.1814). There is a strong end-of-phase effect in the B games where contributions drop to a low level. In B10-exo, average payoffs are higher in the B game than in the A game and the differences are significant in two phases (phases II and III, MWW test, p < 0.1 each). In B8-exo, average payoffs are higher in the A game than the B game and the difference is significant in one phase (phase II, p < 0.1). On average, one player is excluded in the B games and, with one exception, this is always the lowest contributor. As illustrated in Fig. 4, the group size in the B game is very similar in B10 and B10-exo (MWW test, p > 0.1 in all phases). When the exclusion institution comes at a cost, groups playing the B game tend to be slightly larger in B8 than in B8-exo and the difference is weakly significant in phase III (p = 0.0965). Regarding exclusions of individuals and exclusion votes, we find no significant differences between the endogenous and the corresponding exogenous games (p > 0.1 each).Footnote 16
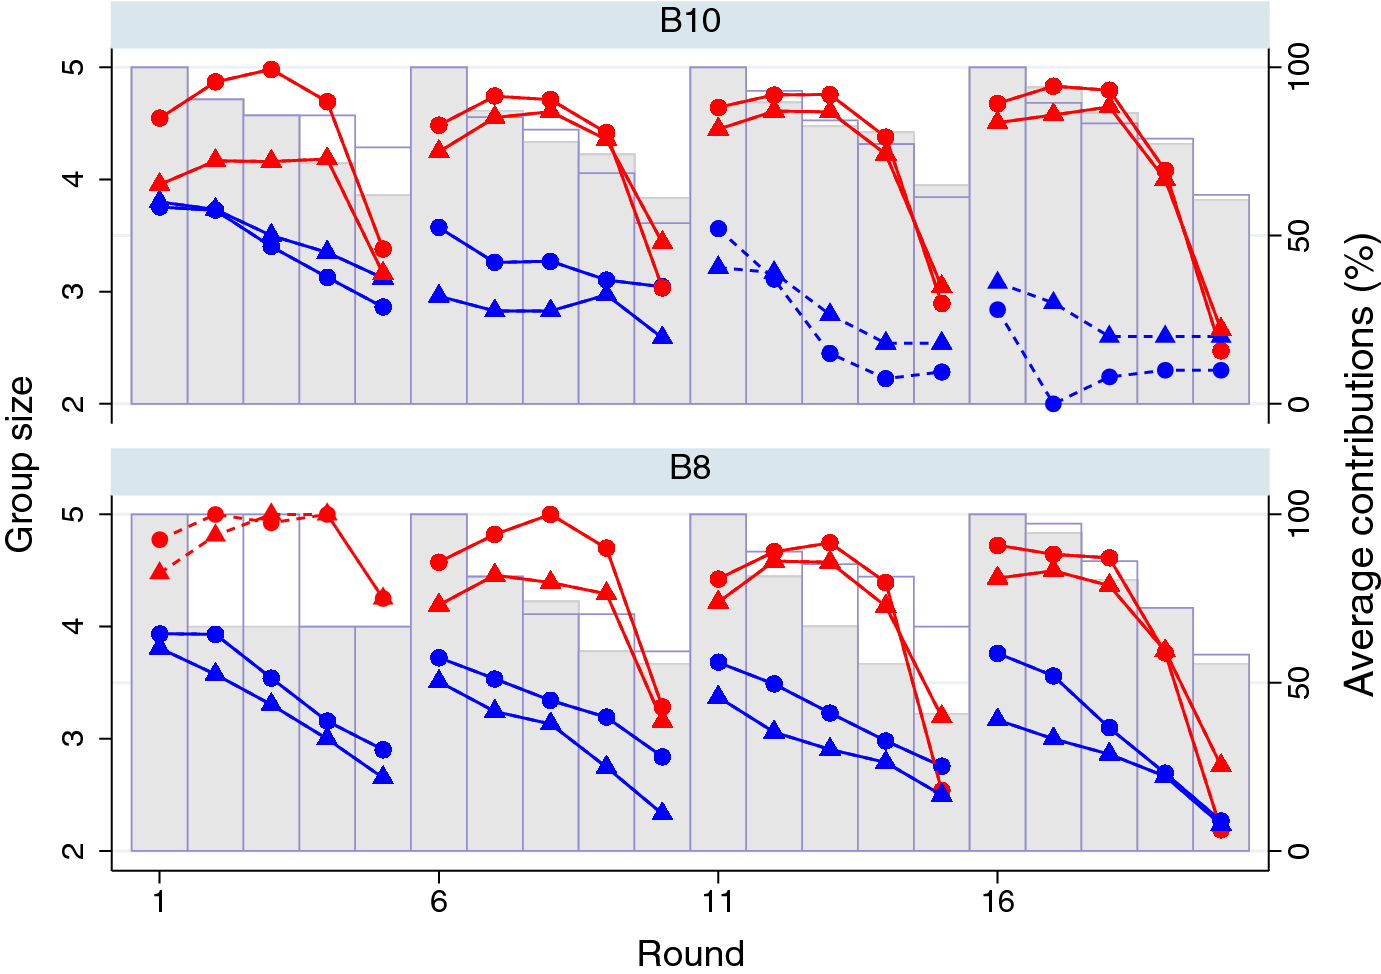
Fig. 4 Comparison of contribution rates between endogenous and exogenous treatments. The figure shows average contributions over time, measured in percent of endowment, in game A (blue) and in game B (red) by treatment. The dashed lines indicate that data points are based on only few observations (N < 5). Observations in the exogenous treatments are marked by triangles. Observations in the endogenous treatments are marked by circles. The bars depict average group size for groups playing game B in the respective phase, for the endogenous treatments (empty bars) and the exogenous treatments (grey bars)
Taken together, behaviors in the endogenous treatments and the exogenous treatments are very similar. In particular, the use and the effectiveness of the exclusion institution are very similar. This suggests that the voting process and self-selection into the institution do not play a major role compared to the effect of the institution itself. A plausible explanation for this is that the exclusion mechanism is perceived as a relatively strong institution that is effective not only for particularly cooperative groups but, once it is implemented, for most groups.
Our results for the exogenous treatments also largely confirm the findings of previous studies (Maier-Rigaud et al. Reference Maier-Rigaud, Martinsson and Staffiero2010; Cinyabuguma et al. Reference Cinyabuguma, Page and Putterman2005). The average contribution rate under the exclusion institution (73% in B10-exo and 71% in B8-exo) is slightly lower than the 80% found by Maier-Rigaud et al. (Reference Maier-Rigaud, Martinsson and Staffiero2010) and the 90% found by Cinyabuguma et al. (Reference Cinyabuguma, Page and Putterman2005). The reason for this may be that exclusion in these studies had more severe consequences than in our setting.
6 Discussion and conclusion
While monetary punishment has been extensively studied in the economics literature, ostracism has received much less attention and, to the best of our knowledge, the endogenous choice of an ostracism institution has not been studied previously at all. With our design, we can test if experimental groups implement an exclusion institution when they have a choice, how the choice affects cooperation and payoffs, if and how supporters and opponents of the institution differ, and how an institutional cost affects behavior. We can also test the differences between an exclusion institution that has been chosen endogenously and one that is exogenously imposed. The behavior in the experiment certainly is noisier and more fluctuating than in theory. An important reason arguably is that the theory assumes common knowledge of preferences while the players in the experiment have at least incomplete knowledge. Thus, they need to make inferences about the co-players’ preferences over the course of play and deal with the remaining uncertainty. Nevertheless, the behavior is far from random and shows remarkable stability with regard to voting between games, contributions, and the exclusions of players. Since our experimental design is not trivial, it is reassuring that our results confirm important findings from the previous literature. Like previous studies of ostracism (Masclet Reference Masclet2003; Cinyabuguma et al. Reference Cinyabuguma, Page and Putterman2005; Maier-Rigaud et al. Reference Maier-Rigaud, Martinsson and Staffiero2010), we find in all of our experimental conditions that the exclusion institution increases contributions to the public good. Subjects who have been excluded or received a vote for exclusion adjust their contributions closer to the group average in later rounds (Masclet Reference Masclet2003; Cinyabuguma et al. Reference Cinyabuguma, Page and Putterman2005).
The novel feature of our experiment is the endogenous choice of the exclusion institution, both when the institution is costless and when there is a cost. We show that the players’ institutional choice can be better explained by assuming social preferences than by the standard model of purely selfish players. The behavior in the experiment closely resembles the predictions of the social preferences models for heterogeneous groups with some, but not only, social players. If the number of social players is high enough, they implement and use the exclusion institution to exclude the selfish players from the group and cooperate thereafter. The experimental results show that the subjects who vote for the exclusion institution contribute significantly more than those who vote against it, but only when the exclusion institution is actually implemented. If the number of social players is too low to implement the exclusion institution, the contributions of the supporters and the opponents of the institution are similarly small, just as the social preferences models predict. Two factors reduce the chances for cooperation in this case: first, the share of social players within the group is smaller and, second, the social players do not have the exclusion institution available to exclude the other players from the group. Once implemented, the exclusion institution is exclusively used to exclude the lowest contributors, which is also in line with the social preferences models. The support for the exclusion institution is lower when there is an institutional cost, but a significant number of players still vote in favor of it. The support becomes stronger over time, especially after the first phase, when players accustom themselves with their group and the game becomes closer to the one in which common knowledge is assumed. Cooperators only profit from the exclusion institution when it is costless. When there is an institutional cost, cooperators on average earn slightly less with the exclusion institution than without it. The observation that many cooperators still vote in favor of the costly exclusion institution indicates that they not only derive utility from material payoffs but also from a more just outcome.
The results help to improve our understanding of the formation of institutions, the role of social preferences in this process, and how an institutional cost affects the institutional choice. Obviously, the institution formation process in the real world is not as clear-cut as in the experiment and typically the circumstances of a particular setting determine whether exclusion of group members is possible or not. The simplification of the process, however, allows us to compare groups that choose differently and individuals who vote differently. The results can help to explain why ostracism is widely used in virtually all societies around the world. With this, our study contributes to the growing literature suggesting that human preferences are heterogeneous and have a significant influence, not only on individual behavior under specific circumstances, but also on how collectives build their institutions to regulate social life.
The comparison of the endogenous treatments with the exogenous control treatments shows that the effects of the exclusion institution on cooperation, once it is implemented, are very similar. This suggests that the effect of the institution itself is more important than the sorting and signaling that comes with the endogenous choice. The relative importance of these different effects is likely to depend on the interplay between the strength of the institution and the voting rule. For example, requiring a qualified majority or unanimity rather than simple majority may sort groups differently and send a different signal to the members. This might be a fruitful area for future research.
Acknowledgements
The work was financially supported by the European Union (EU) Horizon 2020 program, action ERC-2014-STG, Project HUCO, Grant Number 636746.


 Open access