


1 Introduction
The average return on lottery tickets is typically just over 50%, which is considerably lower than the average return on other gambling games, such as horse racing, blackjack and roulette (Clotfelter and Cook Reference Clotfelter and Cook1990). Although buying lottery tickets is not a rational investment from a financial point of view, lottery play is the most popular form of gambling and the majority of the population participates at least once a year in a lottery (Kearney Reference Kearney2005; Garvía Reference Garvía2007). In 2015, the sales in the European lottery sector amounted to approximately €80 billion (The European Lotteries 2015), with European citizens spending on average €100 per person per year on lottery tickets. To increase our understanding of lottery participation, we conducted a field experiment randomly providing free lottery tickets to some participants of an existing household panel survey.
In the economics literature, several explanations for widespread lottery play have been put forward. Already at the end of the 1940s, Friedman and Savage (Reference Friedman and Savage1948) argued that lottery play offers an opportunity to win substantial amounts of money and improve one’s socio-economic status at a relatively low stake. Following the Friedman–Savage hypothesis and its later extensions and modifications (e.g, Pryor Reference Pryor1976; Brunk Reference Brunk1981; Hartley and Farrell Reference Hartley and Farrell2002; Nyman et al. Reference Nyman, Welte and Dowd2008), lottery play is considered rational when it offers the opportunity to improve one’s socioeconomic status or lifestyle when there are few or no other options to realize this otherwise. In prospect theory, widespread lottery play has been attributed to irrational beliefs that people uphold regarding their chances of winning a lottery since people tend to overweight the small chances of winning the lottery (Kahneman and Tversky Reference Kahneman and Tversky1979).
Although there is some empirical support for both the Friedman–Savage theory and prospect theory, several scholars (e.g., Conlisk Reference Conlisk1993; Clotfelter and Cook Reference Clotfelter and Cook1990; Scott and Gulley Reference Scott and Gulley1995) argue that these theories only partly explain people’s propensity to gamble. In particular, the Friedman–Savage theory suggests that lottery is predominantly played among the low and middle social classes. Poorer people indeed tend to spend a larger proportion of their income on lottery tickets (Beckert and Lutter Reference Beckert and Lutter2013), but the theory cannot explain why people play the lottery also in those parts of the income distribution where additional wealth does not result in much additional expected utility (Walker Reference Walker1998; Perez and Humphreys Reference Perez and Humphreys2013). According to prospect theory, some people participate in lottery play because they largely overweight their small chances of winning. However, also this theory cannot explain widespread gambling because most lottery participants have quite rational expectations regarding the outcome of a draw (Forrest et al. Reference Forrest, Gulley and Simmons2000).
A different explanation for widespread lottery play that has received less empirical attention in the economics literature is that lottery play itself has a utility value (Hirshleifer Reference Hirshleifer1966; Eadington Reference Eadington1973; Loewenstein Reference Loewenstein1987; Conlisk Reference Conlisk1993; Le Menestrel Reference Le Menestrel2001).Footnote 1 In other words, there is a non-monetary or process utility of participating in a lottery. Lottery players may experience positive emotions before and after the draw. Positive emotions before the draw may result from one’s hope for a happier life, from the fun and excitement of the game as well as from social bonding activities when the lottery is played together with family or friends (Forrest et al. Reference Forrest, Gulley and Simmons2000; Guillén et al. Reference Guillén, Garvía and Santana2011; Kocher et al. Reference Kocher, Krawczyk and van Winden2014). Positive emotions after the draw may originate from winning a prize, even when the prize is only very small and lower than the purchasing price of the lottery ticket. In addition to the monetary utility of winning a prize, there may also be a non-monetary utility of winning unrelated to the magnitude of the prize (Sheremeta Reference Sheremeta2010). Since most lotteries have many small prizes and the chance of winning a prize is high (in the lottery in our experiment the probability to win a prize is 50%), this could explain the widespread popularity of lottery play, including (seemingly) irrational behavior and the fact that lottery play takes place across the whole income distribution.
While this utility of gambling model has considerable appeal, there is limited empirical evidence in support of this model (Perez and Humphreys Reference Perez and Humphreys2013). This is probably due to the difficulty of identifying an appropriate observable proxy for the procedural utility generated by playing the lottery (see also, Nyman et al. (Reference Nyman, Welte and Dowd2008)). Happiness measures, as suitable indicators of procedural utility measures, have been suggested and applied in economic research (Frey and Stutzer Reference Frey and Stutzer2002; Frey et al. Reference Frey, Benz and Stutzer2004). Burger et al. (Reference Burger, Hendriks, Pleeging and van der Zwan2016), using the British Gambling Prevalence Survey 2010, found a small positive effect of lottery participation on happiness for individuals who engage in lottery play for fun. Bruyneel et al. (Reference Bruyneel, Dewitte, Franses and Dekimpe2005) reported that the purchase of lottery tickets is associated with reducing negative mood. Along similar lines, in a lab experiment Kocher et al. (Reference Kocher, Krawczyk and van Winden2014) identified hope and thrill as determinants of the popularity of Lotto tickets. Other studies showed a positive relationship between the hope of winning and lottery participation (Forrest et al. Reference Forrest, Gulley and Simmons2000; Clarke Reference Clarke2005; Ariyabuddhiphongs and Chanchalermporn Reference Ariyabuddhiphongs and Chanchalermporn2007). These findings are also echoed in studies that examined the motives for lottery play: people do not only play for the money, but also for social bonding and fun (Miyazaki et al. Reference Miyazaki, Langenderfer and Sprott1999; Burger et al. Reference Burger, Hendriks, Pleeging and van der Zwan2016).
In our study, we focus on understanding participation in lotteries. We investigate the utility of lottery play using a field experiment. Some randomly selected participants in a regular panel survey were provided with a free ticket of the Dutch State Lottery while others were not.Footnote 2 We assess the procedural utility of lottery play by comparing the change in momentary happiness (i.e. happiness experienced today) of lottery players and non-lottery players at three points in time: (1) before receiving a (free) lottery ticket, (2) after receiving a lottery ticket but before the draw, and (3) after the draw. We examine both the procedural utility of lottery play before and after the draw. We hypothesize that before the draw, players may gain procedural utility from the excitement of playing the game, the hope of winning a large prize, as well as social bonding, while after the draw players may gain procedural utility from winning a small prize (which was in almost all cases smaller than the original retail price of the ticket). To rule out the possibility that the utility effect we observe is related to receiving a free lottery ticket, and to account for the fact that some people purchased a lottery ticket themselves, we compare four groups of people: with a free lottery ticket, with a purchased lottery ticket, with both a free and purchased lottery ticket, and without a lottery ticket.
Our paper contributes to the economics literature on lottery play and consumption in several ways. First, although many economic studies have addressed the utility gains of lottery wins, this is to the best of our knowledge the first paper to causally identify the procedural utility of lottery play using a large-scale field experiment. Second, in our study we take into account that lottery players may gain procedural utility before and after the draw. We find that lottery participation increases momentary happiness before the draw, but winning a small prize has no effect on momentary happiness. These results indicate that there is a procedural utility of gambling in the sense that people do not only care about winning prizes, but also enjoy the game. We conclude that lottery play has a utility value in itself. Third, and more generally, our article shows that consumption outcomes are not the only source of utility, but consumers also enjoy procedural utility, which is in turn a driving force behind consumer behavior (Frey and Stutzer Reference Frey and Stutzer2002; Frey et al. Reference Frey, Benz and Stutzer2004).
2 Experimental design and data
For our field experiment we used the CentERpanel, a household panel that is maintained by CentERdata, a research institute affiliated with Tilburg University. The panel is representative of the Dutch population and exists since 1991. Currently, the CentERpanel contains well over 2000 households. Panel members use their computers or smartphones to participate in the study and complete questionnaires on a weekly basis. All CentER panel survey participants get compensated for filling out surveys by receiving CentERpanel points, which can be exchanged for money or a gift certificate, or can be donated to charity. The number of points people received for filling out our survey was the same for people who received a free lottery ticket and people who did not receive a free lottery ticket.Footnote 3
The initial objective of our field experiment was twofold: (1) investigate how people that infrequently play the lottery experience lottery play and (2) investigate the non-monetary utility effects of lottery play.Footnote 4 Participants in our experiment filled out a questionnaire at three moments in time. The first questionnaire, held between April 17–28, 2015 (
 ) and filled out by 1611 panel members, was intended to obtain information about the participants’ baseline level of subjective well-being, their gambling behavior—particularly with regard to lottery games—and their socio-demographic characteristics and personality. Subsequently, a large 1300 respondents (81%) were randomly invited to participate in the field experiment. Of the 1300 invitees, 1100 (85%) randomly received a free “full” lottery ticket (purchase price: €15) to participate in the State Lottery. Please note that the main reason why many people received a free ticket is that one of the objectives of the study was to investigate how people that infrequently play the lottery experience lottery play.Footnote 5 This ticket was sent approximately one week before the State Lottery draw of May 10, 2015.Footnote 6
Next, all participants were asked to fill out a second questionnaire between May 8–10, 2015 (
 ) with questions about their subjective well-being and thoughts about lottery play. After the draw of May 10, respondents were asked to complete a third questionnaire between May 10–12, 2015 (
 ) about their subjective well-being, the outcome of the lottery draw (whether the participant won a prize or not), and thoughts about lottery play.Footnote 7 In total, 1299 participants finished the questionnaires at (
 ) and (
 ), while 1155 participants filled out all three questionnaires. After deleting observations with missing data, the analysis sample includes 1142 participants in the
 –
–
 comparison and 1097 respondents in the T1–T3 comparison. We base our analyses on these two groups. To examine the effect of lottery play on procedural utility, we distinguish four groups: (1) people without a ticket, (2) people with only a free lottery ticket, (3) people with only a purchased lottery ticket, and (4) people with both a free and purchased lottery ticket.Footnote 8 This distinction is important for two reasons. First, in our field experiment we cannot rule out that people purchase or have already purchased tickets for the lottery draw. By giving away free tickets for the lottery draw, we try to bypass the problem that our results could be distorted by a selection of happy people or thrill-seekers into lottery play. Second, having only participants with a free ticket and no purchased tickets would also have been a problem, since the procedural utility of participants can originate from obtaining the free ticket itself, when this is considered as a small gift. Overall, we have in our field experiment 122 participants with no ticket, 673 participants with only a free ticket, 49 participants with only a purchased ticket, and 298 participants with both a free and purchased ticket.
We capture procedural utility with momentary happiness, which is measured by the following question: ‘How happy do you feel today?’ with answer categories ranging from 1 (very unhappy) to 10 (very happy).Footnote 9 In particular, we are interested in how people’s daily happiness develops around the lottery draw. On average, the participants in the field experiment scored 7.6 in the first questionnaire, 7.5 in the second questionnaire, and 7.4 in the third questionnaire. These scores are comparable to the average happiness obtained in the Netherlands from other Dutch surveys (Veenhoven Reference Veenhoven2018).Footnote 10
Because of the experimental set-up there is no need for including control variables but we nevertheless did this to account for possible non-randomness in the set-up. As control variables, we included several personal and personality characteristics. The personal characteristics we included are gender, age, income, educational attainment, occupational status, marital status, household composition, and characteristics of the place of residence. The personality characteristics we included are based on answers to questions regarding level of materialism, locus of control, and degree of optimism. In addition, we controlled for the general gambling behavior of the respondents as well as the date on which the respondents completed their questionnaires and how they experienced the survey questionnaires, i.e. whether they enjoyed answering the questions or whether they found it difficult. Finally, we controlled for changes in life satisfaction in the period under observation to account for possible events that affected people’s happiness with life over the period studied. Nevertheless, it should be noted that the evaluation of life satisfaction is—like happiness today—also dependent on momentary moods. Hence, the models in which we control for life satisfaction changes can be considered as conservative estimates for the procedural utility of lottery play.Footnote 11
As a robustness check, we investigated whether the joy of lottery play was contingent on thoughts about the lottery draw and positive and negative feelings regarding the draw, and willingness to pay for a lottery ticket. In our survey at
 , we asked the respondents how often they thought about the State Lottery. Answer categories ranged from 1 (never) to 7 (all the time). In addition, lottery players were asked the following question before the draw (
 ): ‘What emotions do you experience when you think about your participation in the draw of the State Lottery of May 10th?’.Footnote 12 Respondents indicated on a scale from 1 (not at all) to 7 (completely) to what extent they felt happy, hopeful, excited, curious, trusting, amused, and friendly (positive emotions) as well as to what extent they felt worried, sad, annoyed, disappointed, regret, distant, and indifferent (negative emotions). Willingness to pay was examined in the survey at
 , where participants had to make a choice between receiving a small sum of money or a lottery ticket with a retail price of €15 in a hypothetical experiment. An overview of the variables included in the analysis is presented in Appendix A, while the questionnaires are available in online Appendix B.
3 Procedural utility before the draw
We start our analysis by investigating the presence of procedural utility before the draw. Through linear regression, we related happiness to the type of lottery ticket people possessed (purchased, free or both) and to a series of control variables. To remove observed and unobserved time-invariant characteristics from the analysis, we used as dependent variable the change in happiness between survey 1 and survey 2,
 . We assume the following relationship:

where
 represents a vector of interview date fixed effects, i refers to an individual, F is a dummy variable for whether or not a free lottery ticket was received (but no lottery ticket was bought), B is a dummy variable with value 1 if no free lottery ticket was received but one was bought, C is a dummy variable with value 1 if the individual had received a free lottery ticket in addition to having bought one, and
 indicates the first difference of a variable. Furthermore, X is a vector of personal and personality characteristics, S if a vector of survey characteristics and LS represents life satisfaction. Finally,
 to
to
 are our (vectors of) parameters and
 is an error term.
In case of procedural utility before the draw, we expect that the change in happiness between
 and
and
 is significantly larger for lottery participants than for non-lottery participants. Furthermore, we expect that the change in happiness between
 and
and
 is not significantly larger for lottery participants with a free ticket than for lottery participants with a purchased ticket. If there would be a difference, the increase in happiness could be related to a monetary transfer, i.e. receiving the lottery ticket for free.
Table 1 Parameter estimates change in happiness between
 and
and


|
Panel A |
||||
|
Lottery ticket (
|
0.40 (0.12)** |
0.37 (0.13)** |
0.25 (0.11)* |
|
|
|
0.01 |
0.07 |
0.20 |
|
|
Panel B |
||||
|
Free ticket (
|
0.38 (0.13)** |
0.37 (0.13)** |
0.26 (0.12)* |
|
|
Free ticket—no lottery play last year (
|
0.27 (0.12)* |
|||
|
Free ticket—state lottery play last year (
|
0.26 (0.14)# |
|||
|
Purchased ticket (
|
0.56 (0.20)** |
0.52 (0.21)* |
0.39 (0.21)# |
|
|
Free and purchased ticket (
|
0.40 (0.13)** |
0.34 (0.14)* |
0.19 (0.13) |
|
|
|
0.01 |
0.07 |
0.20 |
0.20 |
|
|
0.31 |
0.38 |
0.51 |
|
|
|
0.86 |
0.74 |
0.30 |
|
|
|
0.36 |
0.31 |
0.29 |
|
|
|
0.96 |
|||
|
Personal controls |
No |
Yes |
Yes |
Yes |
|
Lottery behavior controls |
No |
Yes |
Yes |
Yes |
|
Survey controls |
No |
Yes |
Yes |
Yes |
|
Change life satisfaction |
No |
No |
Yes |
Yes |


Based on 1142 observations; reference group: no ticket; robust standard errors in parentheses
**
 , *
, *
 , #
, #

Table 1 provides the OLS parameter estimates for the change in happiness between
 and
and
 .Footnote 13 The first column shows the parameter estimates of the lottery ticket effect on the change in happiness without including control variables. On average, people with a lottery ticket report a significantly higher change in happiness score (Panel A), where there are no significant differences between players with only a free ticket, a free and purchased ticket, and only a purchased ticket (Panel B).Footnote 14 As shown in the second column, our results are robust to including several groups of control variables, i.e. personal characteristics, lottery behavior variables and survey characteristics. In the third column, we also control for the change in life satisfaction in the period between
 and
and
 —which can be considered a very conservative estimate of the lottery play effect. Even then, the effect of obtaining a lottery ticket on the change in happiness is positive and significant. All in all, we conclude that on a scale from 1 to 10, participating in a lottery increases happiness with 0.25–0.40.Footnote 15
One potential problem in our analysis is that in the group of free ticket holders there are individuals that intended to buy a ticket but a free one came along and the purchase never happened. In a sensitivity analysis represented in the fourth column of Table 1, we therefore distinguish between holders of free tickets who played the State lottery last year (and therefore have a higher chance to have the intention to buy a ticket) and holders of free tickets that did not play the State lottery in the last year. As shown, there is no difference in happiness gain between T1 and T2 between the two groups. In the group of people who participated in the State lottery last year, we made a further distinction between frequent and infrequent gamblers (at least monthly vs. less than one time per month). Again, we find no difference between the different groups.Footnote 16
Table 2 Additional parameter estimates change in happiness between
 and
and
 : thinking about the draw

|
Lottery ticket and thoughts about lottery |
||||||
|
No thoughts (
|
0.08 (0.17) |
0.16 (0.16) |
0.07 (0.14) |
0.08 (0.17) |
0.16 (0.16) |
0.07 (0.14) |
|
Thoughts (
|
0.45 (0.13)** |
0.41 (0.13)** |
0.29 (0.12)* |
|||
|
Thought sometimes (
|
0.41 (0.13)** |
0.39 (0.13)** |
0.27 (0.12)* |
|||
|
Thought frequently (
|
0.62 (0.15)** |
0.52 (0.16)** |
0.39 (0.14)** |
|||
|
|
0.02 |
0.08 |
0.20 |
0.02 |
0.08 |
0.20 |
|
|
0.00 |
0.04 |
0.04 |
|||
|
|
0.01 |
0.07 |
0.06 |
|||
|
|
0.00 |
0.02 |
0.02 |
|||
|
|
0.06 |
0.21 |
0.23 |
|||
|
Personal controls |
No |
Yes |
Yes |
No |
Yes |
Yes |
|
Lottery behavior controls |
No |
Yes |
Yes |
No |
Yes |
Yes |
|
Survey controls |
No |
Yes |
Yes |
No |
Yes |
Yes |
|
Change life satisfaction |
No |
No |
Yes |
No |
No |
Yes |


Based on 1140 observations; reference group: no ticket; robust standard errors in parentheses
**
 , *
, *
 , #
, #

It can be argued that it is difficult to gain procedural utility from a lottery draw if one never thinks about the lottery. Hence, we re-estimated our models, using information from the survey shortly before the lottery draw. More specifically, we investigated whether the intensity of thinking about the lottery affects the change in happiness before the lottery draw, i.e. between
 and
and
 . Here, we distinguish between three groups of lottery players: players that never thought about the lottery (answer category 1; 15% of the lottery players), players that sometimes thought about the lottery (answer category 2–3; 69% of the lottery players), and players that frequently thought about the lottery (answer category 4 or higher; 16% ) using the following equation:

where
 represents a vector of interview date fixed effects, LT is a dummy variable indicating whether or not an individual had a lottery ticket irrespective of whether this was bought or received because of the field experiment and
 –
–
 are dummy variables indicating whether the individual had no thoughts about the lottery, sometimes thought about the lottery or frequently thought about the lottery. And,
 –
–
 are (vectors of) parameters.
The first column of Table 2 shows that players who never thought about the lottery did not experience a significantly higher increase in happiness than non-players. At the same time, players who thought about the lottery experienced higher increases in happiness than non-players and players who never thought about the lottery. As shown in the second and third columns, the difference remains significant if we include control variables and also the change in life satisfaction. The fourth to sixth column of Table 2 show that our results hold if we account for the intensity of thinking about the lottery draw. The change in happiness between
 and
and
 after receiving a lottery ticket is present if the individual thought about the lottery, but it does not matter whether the individual thought about the lottery sometimes or frequently.
Along similar lines, it is difficult to gain procedural utility from a lottery draw if one does not have positive feelings when thinking about the lottery. Accordingly, we examined to what extent the procedural utility from a lottery draw is contingent on having overall positive emotions when thinking about the draw. In this regard, it is also interesting to note that participants thinking regularly about the draw experience higher levels of positive emotions and not higher levels of negative emotions compared to participants thinking never or only sometimes about the draw (see Fig. 1). We observe this across the whole range of positive emotions.Footnote 17 In our regression, we investigate whether having positive emotions about the draw affects the change in happiness before the draw (again between
 and
and
 ), where we take the balance of positive to negative affect (PANA) score regarding the draw as main indicator for the positivity ratio when thinking about the draw. We use the following equation:

where
 represents again a vector of interview date fixed effects and LT is a dummy variable indicating whether or not an individual had a lottery ticket irrespective of whether this was bought or received because of the field experiment, PN is a mean-centered continuous variable indicating a respondents’ positivity ratio (PANA) regarding the draw. And,
 to
to
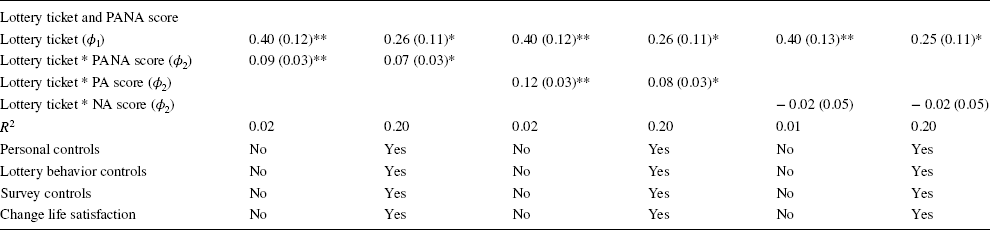
 are (vectors of) parameters. Our regression results are presented in Table 3. The first two columns show that players who had a higher positivity ratio regarding the draw experienced higher increases in happiness, where column 3–6 show that these results are primarily driven by the positive emotions. To exemplify, players that had no or hardly any positive emotions at all regarding the draw (maximum average score on the PA of 2 out of 7), did not experience an increase in happiness between
 and
and
 (
(
 ).
).
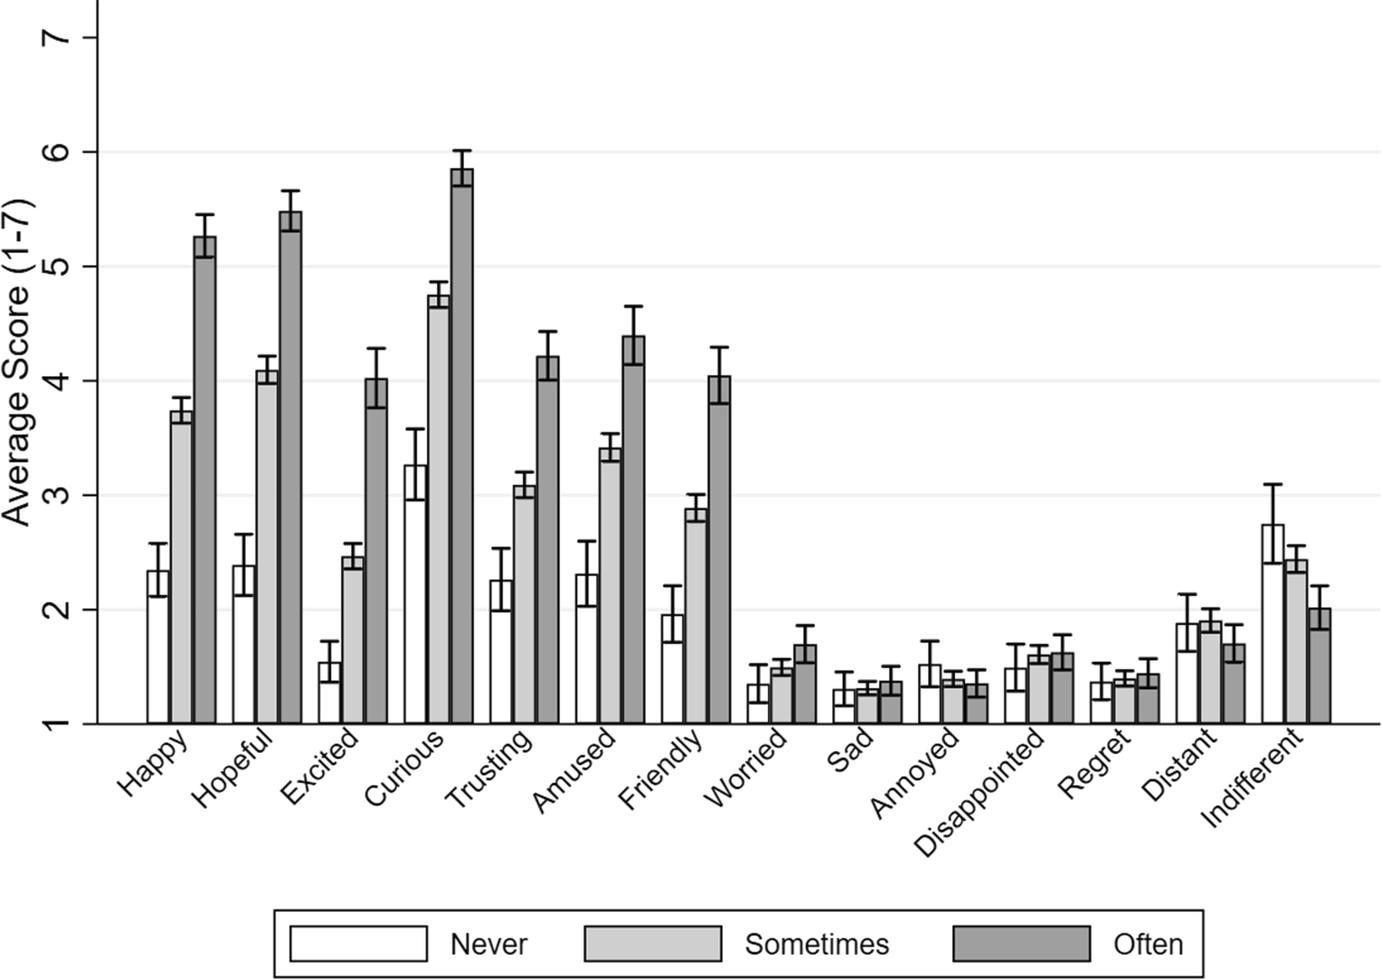
Fig. 1 Positive and negative emotions about participation in the State Lottery; experienced before the lottery draw by frequency of thinking about the draw Note: Only for respondents who possessed a lottery ticket for the lottery draw of May 10; average answers to questions on emotions on a scale from 1 (not at all) to 7 (completely)
Table 3 Additional parameter estimates change in happiness between
 and
and
 : emotions regarding the draw
|
Lottery ticket and PANA score |
||||||
|
Lottery ticket (
|
0.40 (0.12)** |
0.26 (0.11)* |
0.40 (0.12)** |
0.26 (0.11)* |
0.40 (0.13)** |
0.25 (0.11)* |
|
Lottery ticket * PANA score (
|
0.09 (0.03)** |
0.07 (0.03)* |
||||
|
Lottery ticket * PA score (
|
0.12 (0.03)** |
0.08 (0.03)* |
||||
|
Lottery ticket * NA score (
|
− 0.02 (0.05) |
− 0.02 (0.05) |
||||
|
|
0.02 |
0.20 |
0.02 |
0.20 |
0.01 |
0.20 |
|
Personal controls |
No |
Yes |
No |
Yes |
No |
Yes |
|
Lottery behavior controls |
No |
Yes |
No |
Yes |
No |
Yes |
|
Survey controls |
No |
Yes |
No |
Yes |
No |
Yes |
|
Change life satisfaction |
No |
Yes |
No |
Yes |
No |
Yes |


Based on 1140 observations; PANA = positivity ratio; PA (NA) = positive (negative) part of the positivity ratio; reference group: no ticket; Scores are mean-centered; robust standard errors in parentheses
**
 , *
, *

Indirectly, the joy of lottery play could also be inferred from people’s willingness to pay for a lottery ticket. In the survey at
 , participants indicated their willingness to pay for a lottery ticket. In a hypothetical experiment, participants made a choice between receiving a small sum of money or a lottery ticket with a retail price of €15. Although this can also indicate that people overestimate the expected value of a lottery ticket, many people choose to get the lottery ticket when the amount of money they would have received was larger than the retail price of the lottery ticket. Most notably, 43% of the participants preferred the lottery ticket over receiving €17.50, while even 30% of the participants preferred the lottery ticket over receiving €25.Footnote 18
4 Procedural utility of winning a small prize
We want to assess the happiness effect of winning a small lottery prize. For this, we related the change in happiness between surveys 1 and 3,
 to explanatory variables as follows:

where
 represents a vector of interview date fixed effects,
 is a dummy variable for whether or not the individual won a (small) prize and
 to
to
 are (vectors of) parameters.
In case of procedural utility after the draw, originating from winning a small prize, we expect that the change in happiness between
 and
and
 is significantly larger for lottery winners than for non-players. Furthermore, we expect that the change in happiness between
 and
and
 is significantly larger for lottery winners than for non-lottery winners. Finally, we expect that the change in happiness between
 and
and
 is not significantly larger for lottery winners with a free ticket than for lottery winners with a purchased ticket.
In the draw in which the participants of our experiment had a lottery ticket, 49% did not win a prize at all, 39% won less than 10 euro, 11% won a prize between 10 and 100 euro, and 1% won a prize larger than 100 euro. On average, we do not find evidence for procedural utility after the draw, originating from winning a small prize. Lottery winners did not experience a significantly larger change in happiness between
 and
and
 compared to non-players. Nevertheless, as shown in panel A of Table 4 there is a significant difference between those that had a lottery ticket and won a prize and those that had a lottery ticket and did not win a prize.
Panel B of Table 4 shows the parameter estimates if we also make a distinction between the ways through which the individual got a lottery ticket, i.e. purchased, free or both. Now we find that there is only a positive and significant effect for those with a small prize and a free ticket, while at the same time the winners with a free ticket are significantly happier than winners with both free and purchased tickets. These results are independent of whether or not we include control variables and the change in life satisfaction.
Table 4 Parameter estimates change in happiness between
 and
and


|
Panel A |
|||||
|
Lottery ticket and no prize (
|
− 0.10 (0.11) |
− 0.05 (0.11) |
− 0.04 (0.12) |
− 0.09 (0.11) |
− 0.15 (0.10) |
|
Lottery ticket and prize (
|
0.10 (0.11) |
0.15 (0.11) |
0.15 (0.11) |
0.09 (0.11) |
0.02 (0.10) |
|
|
0.01 |
0.02 |
0.02 |
0.06 |
0.18 |
|
|
0.02 |
0.02 |
0.02 |
0.03 |
0.03 |
|
Panel B |
|||||
|
Free ticket and no prize (
|
− 0.15 (0.12) |
− 0.11 (0.12) |
− 0.11 (0.12) |
− 0.15 (0.12) |
− 0.19 (0.11)* |
|
Purchased ticket and no prize (
|
− 0.05 (0.23) |
0.04 (0.25) |
0.04 (0.25) |
0.06 (0.26) |
− 0.03 (0.22) |
|
Free and purchased ticket and no prize (
|
0.05 (0.14) |
0.10 (0.14) |
0.11 (0.14) |
0.04 (0.14) |
− 0.08 (0.13) |
|
Free ticket and prize (
|
0.22 (0.12)# |
0.25 (0.12)* |
0.25 (0.12)* |
0.17 (0.12)* |
0.10 (0.10) |
|
Purchased ticket and prize (
|
0.04 (0.24) |
0.08 (0.25) |
0.10 (0.26) |
0.08 (0.25) |
− 0.00 (0.24) |
|
Free and purchased ticket and prize (
|
− 0.10 (0.13) |
− 0.04 (0.14) |
− 0.03 (0.14) |
− 0.07 (0.15) |
− 0.14 (0.13) |
|
|
0.01 |
0.03 |
0.03 |
0.06 |
0.34 |
|
|
0.43 |
0.47 |
0.52 |
0.71 |
0.67 |
|
|
0.00 |
0.01 |
0.02 |
0.04 |
0.04 |
|
|
0.56 |
0.65 |
0.63 |
0.53 |
0.58 |
|
Personal controls |
No |
Yes |
Yes |
Yes |
Yes |
|
Lottery behavior controls |
No |
No |
Yes |
Yes |
Yes |
|
Survey controls |
No |
No |
No |
Yes |
Yes |
|
Change life satisfaction |
No |
No |
No |
No |
Yes |


Based on 1097 observations; reference group: no ticket; robust standard errors in parentheses
**
 , *
, *
 , #
, #

We conclude from these estimations that only a combination of not having purchased a lottery ticket and receiving one for free and winning a prize leads to an increase in happiness and that the effect of a small prize is very limited. The latter conclusion is supported by a test in which participants (n = 401) who did not see the results of the lottery draw had the opportunity to look up the results via a link in the survey to check whether they had won or not won a prize in the lottery.Footnote 19 This opportunity was provided after the question asking how the participants felt today. At the end of the survey, participants were asked how happy they were feeling at this moment on a scale from 0 to 10. Respondents who viewed the link and won a prize were not significantly happier than respondents who viewed the link and did not win a prize (
 ). This result was found regardless of whether one had a purchased ticket (
 ), a free and purchased ticket (
 ), or a free ticket (
 ).
).
As a robustness check, we also examined differences in specific emotions after the draw. Again participants were asked which emotions they experienced when they thought back about participating in the draw of the State Lottery on May 10th. Although winners reported to be happier and less disappointed, winners and non-winners did only marginally differ regarding the other experienced emotions regarding the draw (see Fig. 2). In a further analysis, we only found evidence for procedural utility for winners that were already positive about the lottery before the draw.Footnote 20 This fuels the idea that the procedural non-monetary utility derived from winning a (small) prize is rather limited.

Fig. 2 Emotions experienced after the draw by winners and non-winners Note: Only for respondents who possessed a lottery ticket for the lottery draw of May 10; average answers to questions on emotions on a scale from 1 (not at all) to 7 (completely)
5 Discussion and conclusions
From a financial point of view buying a lottery ticket is not a rational investment as the average ex-post value of a ticket is just over half the price of that ticket. Nevertheless, many people participate in lotteries. There are two popular explanations in the economics literature for this: (1) low cost opportunities to improve one’s financial position if there are few opportunities to do this otherwise and (2) prospect theory according to which people overweight the small probability of winning a lottery. The first explanation suggests that participation would be predominantly among lower social classes which is not the case since lottery play takes place across the whole income distribution. The second explanation is at odds with the finding that most lottery participants have quite accurate expectations about the probability to win a prize. Although there is some empirical support for both the Friedman–Savage theory and prospect theory, these theories only partly explain people’s propensity to gamble.
We studied lottery participation using a field experiment in which some participants of a regular household survey received a state lottery ticket for free, while other participants had no ticket or only a purchased ticket, or both a free and a purchased ticket. This allows us to investigate to what extent participating in a lottery increases momentary happiness. If so, this supports a third explanation of lottery participation, i.e. people deriving non-monetary utility from participating in a lottery play. This could be because of the hope of winning a large prize, the fun and excitement of the game, or because of social bonding activities when playing the lottery together with family or friends.
In our field experiment, momentary happiness is measured at three moments in time, i.e. before free lottery tickets are issued, after providing some individuals with a free lottery ticket but before the draw, and after the draw. We study the change in momentary happiness between the first two moments to investigate whether playing in the lottery increases momentary happiness, regardless of whether the ticket was bought or free. We also study the change in momentary happiness between the first and third moment to investigate to what extent winning a small lottery prize matters.
Our main finding is that participants in a lottery derive procedural utility from playing the game. This is irrespective of whether the lottery ticket was bought or received for free due to the experiment. On a scale from 1 to 10, participating in a lottery increases momentary happiness with 0.25–0.40 (approximately 1/5–1/3 standard deviation increase). These results may be driven by the hope and expectations about financial gains, the thrill of a potential win, and social bonding when playing as a group. However, the procedural utility that players derive from winning a small prize is limited. In sum, we conclude that lottery participation seems to be at least partly driven by the joy of lottery play, i.e. lottery participants may be hoping for financial gains but gamble for fun. More generally, our research shows the importance of taking in procedural utility in modeling decisions of consumers since consumers do not only care about outcomes, but also about the process. Accordingly and in line with previous work, seemingly irrational decisions such as lottery play could be considered rational from the perspective of procedural utility (see also Benz Reference Benz2005).
It is important to note that our results are related to the probability of winning which is about 50% in the State Lottery. For lotteries with a smaller winning probability the magnitude of the happiness effects are smaller. It is also important to note that our article has focused on the short-term positive impact on lottery play through procedural utility and does not pay attention to the potential negative long-term effects of lottery play, especially in the case of problem and pathological gambling (Lorenz Reference Lorenz1990). In this regard, lottery gambling has been associated with psychological, social, and economic problems. Hence, procedural utility may induce sub-optimal decision-making in the long-run. At the same time, the number of problem lottery gamblers among the population is relatively small (Hendriks et al. Reference Hendriks, Meerkerk, Van Oers and Garretsen1997) and the overall long-term effects of lottery play on overall well-being or experienced quality of life seem to be limited (Burger et al. Reference Burger, Hendriks, Pleeging and van der Zwan2016). However, more research on the consequences of lottery play are needed to examine the long-term effects of lottery play.
Compliance with ethical standards
Conflict of interest
The authors declare that they have no conflict of interest. The authors have received funding from the State Lottery for data collection. Apart from this, no funding was used to conduct the present study, and the financiers of the data collection had no role in the study design, data collection and analysis, decision to publish, or preparation of the manuscript.
Appendix A: Overview of control variables
• Personal characteristics
• Female: Dummy variable indicating whether the respondent is female
• Age: Age in years
• Employed: Dummy variable indicating whether the respondent is working
• Unemployed: Dummy variable indicating whether the respondent is unemployed
• High household income: dummy variable indicating whether the net monthly household income is over €2600
• High education level: Dummy variable indicating whether the respondent finished at least a study program at ISCED 5–6 level
• High socio-economic status: Self-assessed status regarding salary, job and social status.
• Partner: Dummy variable indicating whether the respondent has a partner
• Children: Dummy variable indicating whether the respondent has children
• Urban environment and region: Dummy variables indicating level of urbanity of residence is at least high or very high; Dummy variable whether the respondent lives in the North, East, or South of the Netherlands (West is reference group)
• Personality characteristics (including gambling behavior)
• Materialism: Score on Richins’s Material Values Scale (Richins Reference Richins2004)
• Optimism: Score on the Life Orientation Test—Revised (Scheier et al. Reference Scheier, Carver and Bridges1994)
• Internal locus of control: Score on Short version of the Levenson IPC scale (Sapp and Harrod Reference Sapp and Harrod1993)
• Frequency of lottery participation: Dummy variable indicating that a respondent has at least participated in the State lottery a few times in the last year
• Won in past year: Dummy variable indicating the respondent has had a win in the State lottery in the past year
• Thinks chance of winning is high: Dummy variable indicating that the respondent assessed the chances of ever winning a large price is high (larger than a score of 3 on a seven-point scale)
• Perceived survey characteristics
• Change in duration questionnaire: Difference in duration of questionnaire in minutes for the different time points.
• Change in enjoyability questionnaire: Difference in enjoyability for the different time points. Based on the question: Did you enjoy filling out this questionnaire? (1 = Not at all; 5 = Very much).
• Change in difficulty questionnaire: Difference in duration of questionnaire for the different time points. Based on the question: Did you find it difficult answering the questions in this questionnaire? (1 = Not at all; 5 = Very much).
• Change in life satisfaction: Change in life satisfaction score between two surveys. Based on the question: All things considered, how satisfied are you with your life-as-a-whole? (1 = very dissatisfied; 10 = very satisfied) (Table 5).
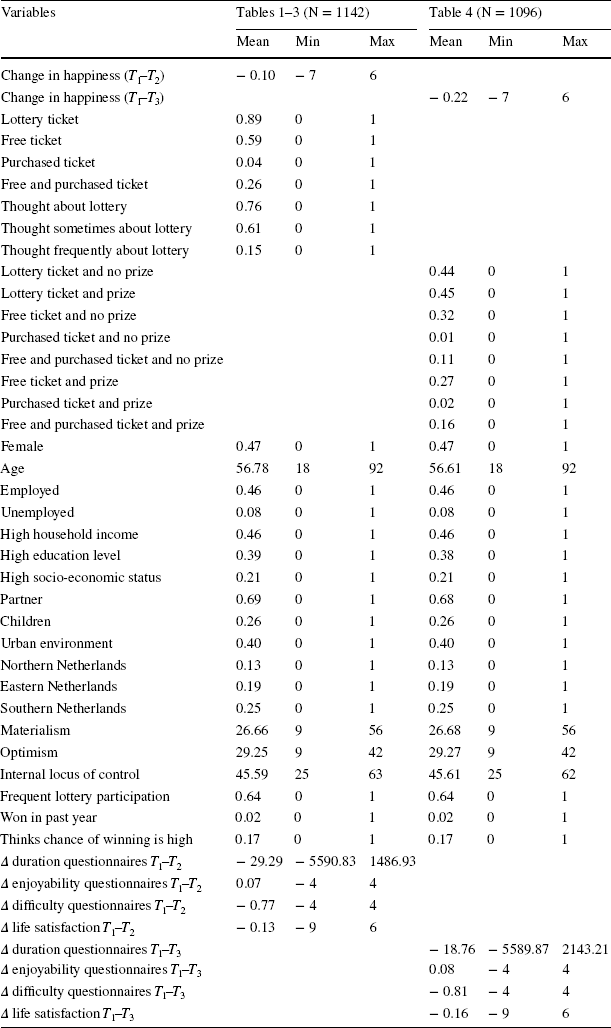
Table 5 Descriptive statistics
|
Variables |
Tables 1–3 (N = 1142) |
Table 4 (N = 1096) |
||||
|---|---|---|---|---|---|---|
|
Mean |
Min |
Max |
Mean |
Min |
Max |
|
|
Change in happiness (
|
− 0.10 |
− 7 |
6 |
|||
|
Change in happiness (
|
− 0.22 |
− 7 |
6 |
|||
|
Lottery ticket |
0.89 |
0 |
1 |
|||
|
Free ticket |
0.59 |
0 |
1 |
|||
|
Purchased ticket |
0.04 |
0 |
1 |
|||
|
Free and purchased ticket |
0.26 |
0 |
1 |
|||
|
Thought about lottery |
0.76 |
0 |
1 |
|||
|
Thought sometimes about lottery |
0.61 |
0 |
1 |
|||
|
Thought frequently about lottery |
0.15 |
0 |
1 |
|||
|
Lottery ticket and no prize |
0.44 |
0 |
1 |
|||
|
Lottery ticket and prize |
0.45 |
0 |
1 |
|||
|
Free ticket and no prize |
0.32 |
0 |
1 |
|||
|
Purchased ticket and no prize |
0.01 |
0 |
1 |
|||
|
Free and purchased ticket and no prize |
0.11 |
0 |
1 |
|||
|
Free ticket and prize |
0.27 |
0 |
1 |
|||
|
Purchased ticket and prize |
0.02 |
0 |
1 |
|||
|
Free and purchased ticket and prize |
0.16 |
0 |
1 |
|||
|
Female |
0.47 |
0 |
1 |
0.47 |
0 |
1 |
|
Age |
56.78 |
18 |
92 |
56.61 |
18 |
92 |
|
Employed |
0.46 |
0 |
1 |
0.46 |
0 |
1 |
|
Unemployed |
0.08 |
0 |
1 |
0.08 |
0 |
1 |
|
High household income |
0.46 |
0 |
1 |
0.46 |
0 |
1 |
|
High education level |
0.39 |
0 |
1 |
0.38 |
0 |
1 |
|
High socio-economic status |
0.21 |
0 |
1 |
0.21 |
0 |
1 |
|
Partner |
0.69 |
0 |
1 |
0.68 |
0 |
1 |
|
Children |
0.26 |
0 |
1 |
0.26 |
0 |
1 |
|
Urban environment |
0.40 |
0 |
1 |
0.40 |
0 |
1 |
|
Northern Netherlands |
0.13 |
0 |
1 |
0.13 |
0 |
1 |
|
Eastern Netherlands |
0.19 |
0 |
1 |
0.19 |
0 |
1 |
|
Southern Netherlands |
0.25 |
0 |
1 |
0.25 |
0 |
1 |
|
Materialism |
26.66 |
9 |
56 |
26.68 |
9 |
56 |
|
Optimism |
29.25 |
9 |
42 |
29.27 |
9 |
42 |
|
Internal locus of control |
45.59 |
25 |
63 |
45.61 |
25 |
62 |
|
Frequent lottery participation |
0.64 |
0 |
1 |
0.64 |
0 |
1 |
|
Won in past year |
0.02 |
0 |
1 |
0.02 |
0 |
1 |
|
Thinks chance of winning is high |
0.17 |
0 |
1 |
0.17 |
0 |
1 |
|
|
− 29.29 |
− 5590.83 |
1486.93 |
|||
|
|
0.07 |
− 4 |
4 |
|||
|
|
− 0.77 |
− 4 |
4 |
|||
|
|
− 0.13 |
− 9 |
6 |
|||
|
|
− 18.76 |
− 5589.87 |
2143.21 |
|||
|
|
0.08 |
− 4 |
4 |
|||
|
|
− 0.81 |
− 4 |
4 |
|||
|
|
− 0.16 |
− 9 |
6 |
|||


 T1
T1 T2
T2
 T1
T1 T2
T2

 T1
T1 T2
T2
 T1
T1 T3
T3


 Open access