


1 Introduction
The idea that markets can aggregate dispersed private information into prices is central to much of economic thinking.Footnote 1 When some traders are fully informed about the true state of the world, competitive bidding will push prices to reflect the true state, thus revealing the information to uninformed traders. A more challenging case is when each trader only holds partial information about the true state. If traders understand how the different pieces of information affect behaviour, the movement of prices eventually reveals the information held by other traders. Furthermore, if traders continuously condition their market demands on their own information, then market prices should continuously move until no trader can learn any more from the prices.Footnote 2 Naturally, whether equilibrium market prices fully reveal the true state depends on the information structure. Radner (Reference Radner1979) showed that prices converge to an equilibrium as if each trader openly and truthfully communicates his own private information. This result, however, requires that traders hold diverse or heterogeneous partial private information and that the true state is in the unique element within the intersect of at least two different private information.Footnote 3 This analysis equates the states of the world with beliefs over the traded assets’ possible valuations. It remains an open question, therefore, whether market prices are able to fully reveal the true state even when traders hold identical or homogeneous partial private information, in the sense that it induces the same beliefs over asset valuations. This paper studies the information aggregation properties of markets in a novel design that allows us to clearly distinguish between situations where traders hold homogeneous and heterogeneous partial private information about the true state of the world.
Empirical studies suggest that the intricate process of information aggregation (e.g., learning about the information of others through price movements) postulated by theory often places too many demands on the abilities of the traders [see De-Bondt and Thaler (Reference De-Bondt and Thaler1985), Thaler (Reference Thaler1988), Hirshleifer (Reference Hirshleifer2001) and Shleifer (Reference Shleifer2000)]. However, identifying ‘who knows what’ is often challenging in empirical market research. Controlled experimental environments complete the picture by studying market behaviour in a highly structured environment, where the experiment designer controls the information structure. Laboratory experiments study the general principles underpinning economic behavior with extraordinary control over independent variables, and generally generalise well to various field environments (Camerer Reference Camerer, Frechette and Schotter2015). Market experiments, in particular, yield similar results with student and businessmen populations (e.g., Porter and Smith Reference Porter and Smith1994).
In a study of information dissemination in experimental single-period markets, Plott and Sunder (Reference Plott and Sunder1982) found that asset prices converge to fully reveal the true state even when only a subset of the traders had full information about the true state.Footnote 4 Markets where traders have partial information pose a greater challenge to successful convergence, as market prices have a double role of information aggregation and dissemination (e.g., Plott and Sunder Reference Plott and Sunder1988; Forsythe and Lundholm Reference Forsythe and Lundholm1990; Copeland and Friedman Reference Copeland and Friedman1987; Camerer and Weigelt Reference Camerer and Weigelt1991; O’Brien and Srivastava Reference O’Brien and Srivastava1991).Footnote 5 Plott and Sunder (Reference Plott and Sunder1988) pioneered the laboratory study of information aggregation in single-period markets structured as event-contingent assets. In their experiments, the true state of the world can either be X, Y or Z with some known probabilities. For each state other than the true state, half of the traders are informed of the false state. For example, let the true state be Y. In this case, half of the traders know the true state to be either X or Y (i.e., not Z), and the other traders know the true state to be either Y or Z (i.e., not X). Thus, traders have heterogeneous information that, if aggregated efficiently, is enough to fully reveal the true state. In the treatments closest to our design, the market consists of three types of assets x, y and z, which pay a positive dividend for the states X, Y, and Z, respectively (e.g., asset x pays a positive dividend if and only if the true state is X).Footnote 6 The results of Plott and Sunder (Reference Plott and Sunder1988) show that market prices converge to the true value of the asset—thereby revealing the true state—even when there is no immediate incentive for any trader to reveal their private information. However, the information structure used in the experiments greatly facilitates information dissemination and aggregation. For example, if the true event is Y, then the distribution of private information implies that demand for asset y will easily outstrip those for assets x and z.Footnote 7 As such, the market demand for asset y relative to those of assets x and z will immediately reveal the true event to be Y.
In this paper, we study a more complex and asymmetric information structure. This structure allows us to test an environment where information aggregation requires counterfactual reasoning, and to test gradual aggregation and dissemination of information. The information structure we employ differs from that of Plott and Sunder (Reference Plott and Sunder1988) in two important ways. First, it relaxes the one-to-one relation of states of the world to profitable assets (Arrow–Debreu securities) by allowing different states to map onto the same asset. Second, while the states of the world are symmetric and equiprobable, the different possible asset evaluations are not. This asymmetry in information translates to asymmetry with regards to the information held by different types of traders.
These two design innovations raise two new issues, respectively. First, as different states of the world map to the same asset value, we generate a situation where, in some states, all of the traders hold exactly the same beliefs over the assets’ values despite having diverse information regarding the underlying state of the world. In previous studies, such as Plott and Sunder (Reference Plott and Sunder1988), traders always potentially observe some market activity (asks, bids, or transactions) that is inconsistent with some state of the world that they consider possible. Such market activity reveals that there exist other traders who hold different information, and thus conveys new information about the true state. In our setting, in contrast, the different information held by different traders translates to the same beliefs and the same market activity, hence the observed market activity does not provide any new information regarding the true state. The diverse information held by different traders, if aggregated successfully, is nonetheless sufficient to fully reveal the true state. To do so requires counterfactual reasoning: traders should realize that all observed market activity is consistent with their own beliefs about the assets’ values, and consequently eliminate the states of the world in which some of the other traders hold differing beliefs. Our experiment tests whether this feature of the market impedes, or even prevents, successful aggregation of information.
Second, in states of the world where different traders do hold different beliefs, we can identify a minority of traders who hold different beliefs to those held by the majority traders. Since the majority traders dominate the market and the price setting, the minority traders stand to better learn new information from the initial movement of prices. Accordingly, we test whether these minority traders become better informed about the true state of the world and about the true value of the assets, and whether they can leverage this knowledge for profit.Footnote 8
Finally, previous studies have focused on aggregate outcomes in the market. Our experimental design introduces yet another new feature. To test individual belief updating and information dissemination, we elicit traders’ post-market beliefs about the true asset-relevant event. This allows us to test whether individual revelation of the true state is a necessary condition for information revelation in market prices.
We present a simple fully revealing rational expectations equilibrium (FRE) model, which shows that information aggregation and full revelation of the true state is possible in our setup both when traders’ beliefs over the assets’ values are heterogeneous and homogeneous. Furthermore, when traders hold heterogeneous private information, the model predicts that a minority subset of traders (the minority traders) will learn about the true state before the others and will be instrumental in driving prices towards the FRE. Against this backdrop, three questions are investigated:
- RQ1:
-
Can Arrow–Debreu markets be successful at aggregating private information about the true event into prices, even when traders are endowed with homogeneous beliefs, such that information aggregation is challenging and requires traders to employ sophisticated counterfactual reasoning?
- RQ2:
-
Are minority traders better informed about the true event, can they leverage this knowledge for profit, and are they instrumental in driving prices to reveal the true state?
- RQ3:
-
Can individuals in the market learn the true event from the movement of prices, and is individual learning a necessary condition for information aggregation in the prices?
To measure success at information aggregation in the experimental setting, we benchmark the FRE model against a prior-information equilibrium (PIE) model.Footnote 9 The PIE model assumes that the traders update their beliefs given their private information, but fail to take market activity into account. Thus, we test the ability of the market to aggregate dispersed information by comparing the observed final market prices to the FRE and PIE predictions. The post-market beliefs allow us to test the role of individual beliefs in market prices convergence to the true values and the dissemination of information throughout the market. By repeating the market game, we are able to test the role of market experience in information aggregation and dissemination.Footnote 10
Our findings can be summarised as follows. Markets are successful at aggregating dispersed information in the prices when traders are experienced, but not in early rounds. Although market prices reflect the true state, traders largely remain ignorant in the post-market stage. This finding is consistent with the marginal trader hypothesis (e.g., Forsythe et al. Reference Forsythe, Nelson, Neumann and Wright1992), which posits that efficiency in market prices only require a small population of sophisticated traders, who are influential in driving prices to the competitive equilibrium. We observe successful price convergence even in the more challenging case of homogeneous beliefs. That is, we do not find any significant differences in the information aggregation properties of markets when traders are endowed with homogeneous or heterogeneous private information. Finally, we find some evidence suggesting that minority traders learn about the true event before others and are instrumental in driving prices towards the FRE. There is no evidence, however, that the better-informed minority traders are able to extract a higher share of the surplus.
2 Experimental design
We conducted 7 experimental sessions involving 12 subjects each. Participants were recruited from the subject pool of the experimental economics laboratory at Ben-Gurion University of the Negev using the recruitment software ORSEE (Greiner Reference Greiner2015). All sessions were programmed with the z-Tree (Fischbacher Reference Fischbacher2007) software. Subjects in each session were first given 45 min to familiarise themselves with the instructions, complete an accompanying set of control questions and participate in two non-paying practice rounds (see the “supplementary Appendix” for the translated instructions). The experiment itself included 10 rounds. All payoffs were stated in ECU (Experimental Currency Unit), and converted to New Israeli Shekels (NIS) at the end of the experiment at a conversion rate of 15 ECU = 1 NIS. The final payoff consisted of the payoff of one randomly chosen round in addition to a show-up fee of 25 NIS. The average payment including show-up fee was 73.33 NIS (approximately 21 USD). Average session duration was approximately 120 min.
2.1 Market structure and procedure
The twelve traders are randomly allocated into three groups of four traders each. Each group
 is randomly assigned to be of type X or type O with equal probabilities. Thus, there are eight equally probable states of the world
 , where
 denotes group k’s type.Footnote 11 Let the event
 denote the total number of type X groups at state s (e.g.,
 iff
iff
 ). At each state
 , traders observe the type of the two other groups, but not their own group’s type. For example, in the case where
 , the first two groups observe one X and one O, hence only events 1 and 2 are possible. The third group observes two X’s, hence only events 2 and 3 are possible.
For the true state
 , we define the event
 as the corresponding true event. This distinction is necessary as market prices will convey information about the true event rather than the true state. The information structure is commonly known and endows traders with private and partial information over the true event. For example, if
 , then all traders will observe two other type X groups, implying that they each know the true event
 to be either 2 or 3.
Trade involves four “types” of Arrow–Debreu assets, indexed by
 . The value of asset
 given the true event
 is given by

Each trader is endowed with a working capital loan of 5000 ECU and six units of each of the four assets. There are four simultaneous markets, one for each asset. Trade is conducted using the Continuous Double Auction (CDA) mechanism for a duration of 300 s. Short sales are prohibited, and a price ceiling of 200 ECU is imposed on the bid and ask prices to limit potential negative profits. Note that traders at the start of the markets do not know the value of each asset (i.e., they don’t know which assets are valued at 0 or 100). Instead, they only know that the value of each asset can be either 100 or 0, depending on the true event
 .
.
After 300 s, the CDA market closes and traders enter the post-market stage. Here, traders are asked to guess how many type X groups were in the market. The response
 is taken to be participant i’s elicited belief.Footnote 12 The payment for beliefs is given by

At the end of the round, traders receive feedback on the true state, the unit value and number of units owned for each of the four assets, and their detailed final round payoff. The round payoff consist of the total value of owned assets and remaining capital, minus the initial loan of 5000 ECU, plus payment for the submitted beliefs.Footnote 13 Denote by
 and
and
 trader i’s inventory of capital and asset
 , respectively. Thus, each trader i’s payoff is given by:

where the first term captures the consequences of the trader’s market decisions and the second his submitted beliefs.
3 Theoretical analysis
3.1 Preliminaries
We shall refer to the events
 as the heterogeneous events, given that they induce different beliefs in different traders. That is, the private information held by traders in one group, the minority traders, induces different beliefs over the assets’ valuations than for the other traders. For example, if
 , groups 1 and 2 know that the true event is either 1 or 2, while group 3 (the minority traders) knows that the true event is either 2 or 3. In the complementary events
 , all traders observe the same number of X’s, and therefore hold the same beliefs over the events x(s). We therefore refer to these events as the homogeneous events. For example if
 , all traders know that the true event is either 2 or 3. Naturally, it follows that there are no minority traders in homogeneous events.
3.2 The FRE and PIE models
The experimental design endows traders with partial and private information about the true event. Because the complexity of the CDA mechanism makes it extremely difficult to analyse with standard game theoretical methods, we evaluate the market’s success at aggregating information by comparing market prices against the fully revealing rational expectations equilibrium (FRE) and the prior–information equilibrium (PIE) described in full below. Table 1 details the FRE and PIE predicted prices of each asset
 in the market and the corresponding implied proportion of submitted beliefs in the post-market stage.Footnote 14
Table 1 Predicted prices and beliefs

|
True event |
Market prices |
Submitted beliefs |
||||||
|---|---|---|---|---|---|---|---|---|
|
|
|
|
|
|
|
|
|
|
|
Panel A: Fully revealing equilibrium rational expectations (FRE) |
||||||||
|
|
100 |
0 |
0 |
0 |
1.00 |
0 |
0 |
0 |
|
|
0 |
100 |
0 |
0 |
0 |
1.00 |
0 |
0 |
|
|
0 |
0 |
100 |
0 |
0 |
0 |
1.00 |
0 |
|
|
0 |
0 |
0 |
100 |
0 |
0 |
0 |
1.00 |
|
Panel B: Prior-information equilibrium (PIE) |
||||||||
|
|
50 |
50 |
0 |
0 |
0.50 |
0.50 |
0 |
0 |
|
|
0 |
50 |
50 |
0 |
0.17 |
0.50 |
0.33 |
0 |
|
|
0 |
50 |
50 |
0 |
0 |
0.33 |
0.50 |
0.17 |
|
|
0 |
0 |
50 |
50 |
0 |
0 |
0.50 |
0.50 |


 denotes the predicted price of asset
 and
and
 denotes the predicted proportion of traders submitting beliefs

The PIE describes the market clearing prices when risk-neutral traders use Bayes’ rule to update their posteriors about the true event given their own private information and condition their demands upon such posteriors. However, there is no belief updating following trade, and consequently the true event is only partially revealed in prices. For example if
 , then traders in groups 1 and 2 will assign equal posteriors to the events 1 and 2, whilst those in group 3 will assign equal posteriors to the events 2 and 3. As traders condition their demand for assets on their posteriors, the corresponding market clearing prices are 0, 50, 50 and 0 for assets
 ,
,
 ,
,
 and
and
 , respectively.Footnote 15 Uniformed of the true event, traders in groups 1 and 2 will uniformly randomise between the responses
 and
and
 . Similarly, those in group 3 will randomise between the responses
 and
and
 .
.
In contrast to the PIE, the FRE describes an outcome where risk-neutral traders not only use Bayes’ law to update their posteriors but also continuously learn about the private information of others from market prices. This endogenous process continues until no trader can learn any more from prices and the true event is fully revealed in the prices. Since all traders are fully informed about the true event by definition, this should be reflected in their submitted beliefs.
In many respects, both equilibria describe some form of market aggregation. Where they differ is on the issues as to whether the true event is partially (PIE) or fully (FRE) revealed in prices. The expected market payoff in both PIE and FRE is 600. The expected post-market payoff is 0 and 200 for the former and latter, respectively.
How prices might actually converge to the FRE remains an open question. There is an extensive literature that discusses the dynamic behaviours of traders (e.g., Dubey et al. Reference Dubey, Geanakoplos and Shubik1987; Hellwig Reference Hellwig1982; Ostrovsky Reference Ostrovsky2012; Radner Reference Radner1979). However, the complexity of such models are largely beyond the scope of our experimental design. Furthermore, Biais and Pouget (Reference Biais and Pouget1999) show that given the information asymmetry in our design, there should be no trade in equilibrium, except at the FRE prices. Yet without trade at non FRE prices, it is difficult to see how traders learn about the true state.
In the following subsection, we present a simple reasoning model describing the convergence process supporting the FRE prices.Footnote 16 As we later elaborate, counterfactual reasoning by traders will play in integral role in the convergence process.
3.3 The reasoning model
The model builds on Jordan’s (Reference Jordan1982) discussion of the way in which prices may first converge to some ‘pre-equilibrium’ on the path to the FRE.Footnote 17 Trade takes place over
 hypothetical periods. Traders are risk-neutral, not capital constrained, always seek to maximise payoffs and are non-strategic in the sense that they trade in each period as if it were the last. Denote
 as the period t price of asset
 . Given the above, the model assumes that behaviours at each period t are described by the following four stages:
- Stage 1.
-
Traders observe the period
 prices of each asset (i.e.,
).
prices of each asset (i.e.,
). - Stage 2.
-
Traders update their beliefs regarding the true event.
- Stage 3.
-
Traders condition their demands for assets given their updated posteriors or beliefs.
- Stage 4.
-
The market clears and period t prices are established.


To see how convergence to the FRE occurs in the reasoning model, first consider the case where
 or
or
 (homogeneous event). Here, all traders observe two type X groups and therefore assign equal posteriors to the events 2 and 3. At period
 , traders condition their asset demands on such posteriors. This results in the market clearing prices:
 and
and
 (the PIE prices). At period
 , traders observing the previous period prices will reason the true event to be 3. The reasoning is as follows. If the true event were 2, some traders would have observed one X and one O. Such traders would assign a posterior probability of 0.5 to the event 1, driving
 up to 50. Since
 , this must mean that no trader observes only one other X ruling out event 2. Conditioning their demands on the updated beliefs now results in the market clearing prices:
 and
and
 (the FRE prices). Since the true event is fully revealed in
 , there should be no revisions to the prices in periods
 and
and
 . This process of information aggregation holds by symmetry for the
 case.
case.
Now consider the case where
 or
or
 (heterogeneous event). Here, traders in groups 1 and 2 observe one type X group and therefore assign equal posteriors to the events 1 and 2. Conversely, the minority traders in group 3 observe two type X groups and therefore assign equal posteriors to the events 2 and 3. At period
 , traders condition their asset demands on such posteriors, resulting in the market clearing prices:
 and
and
 (the PIE prices).Footnote 18 At period
 , the minority traders, having observed non-zero prices for asset 1, can deduce that some of the other traders observed a type O group. This rules out event 3 from being the true event, hence the true event must be
 . In contrast, the non-minority traders (those in groups 1 and 2), who already knew that there is at least one type O group receive no new information from the prices, and therefore remain uninformed. Given the updated beliefs, there is still excess demand for asset 1 by groups 1 and 2, leading to market clearing prices of
 and
and
 .Footnote 19 However, given their higher valuations, the market mechanism will allocate asset 2 to the minority traders. At period
 , groups 1 and 2 again remain uninformed of the true event. Given that the trade of asset 2 will now mostly involve group 3 traders, though, the subsequent market clearing prices will be:
 ,
,
 and
and
 .Footnote 20 At period
 , the non-minority traders observing that
 , should conclude that the true event is
 . As traders condition their asset demands on their updated beliefs, we arrive at the market clearing prices:
 and
and
 , the FRE prices.Footnote 21 This process of information aggregation holds by symmetry for all states where
 .
.
The main results of the reasoning model are as follows. Firstly, convergence to the FRE prices is possible for all states and events. Secondly, on the path of convergence towards the FRE, prices go through the PIE prices. Finally, minority traders (heterogeneous event) learn about the true event before the other traders and are ‘instrumental’ in driving prices towards the FRE.
3.3.1 Some comments
The model assumes that traders only update their beliefs on observed prices. In CDA markets, traders can also learn from the volume of transactions or the unfilled bid and ask prices. Will these additional elements influence the information aggregation process? Suppose that traders only update their beliefs on observed transaction volumes. When
 , transactions should be concentrated on assets 2 and 3. So again, traders will only learn about the true event through reasoning about why transactions for asset 1 is relatively low. When
 , transactions should be concentrated on assets 1 and 2.Footnote 22 As such, minority traders should still learn about the true state before the others. Consequently, transaction volumes for asset 2 will increase relative to those for asset 1 as minority traders concentrate their purchases on the true asset. Non minority traders will thus learn the true event to be 2. Thus, the additional elements do not seem to alter the information aggregation process in any substantial way.
The model suggests that convergence to the FRE might be more challenging for the heterogeneous information events given that minority subjects must first be informed about the true event and be instrumental at driving prices towards the FRE.Footnote 23 At the same time, convergence to the FRE also requires agents to employ counterfactual reasoning. In heterogeneous information events, agents make inferences from actual observed trade. In the homogeneous information events, in contrast, agents deduce the true event from not observing trade on an asset, which would have been traded in some counterfactual event. Recognising that empirical (experimental and otherwise) data are often noisy, and some trade is likely to happen, it is not clear whether low volumes or prices are enough for agents to be confident at ascertaining the true event. Even complete market inactivity is somewhat ambiguous, as it is not clear how much time should be allowed to elapse before concluding that there is no demand for the asset. Lack of trade may be explained, for example, by agents concentrating on other parts of the market. For these reasons, convergence to FRE prices may depend on the information structure, with homogeneous beliefs leading to slower convergence.
4 Experimental results
To study prices in dynamic CDA markets, we partition the market data into time windows of 30 seconds, each indexed by
 . Denote by
 the mean transaction price for asset
 in window t. For example,
 corresponds to the mean transaction price of asset 3 within the 30–60 s time window. Where
 cannot be computed as there are no transactions in the time window, we employ the carry forward rule, substituting
 with the last known computed price.Footnote 24 As such,
 will always reflect the most recent price for asset
 . Where appropriate, we will also consider the prices without the carry forward rule, denoted by
 . That is,
 if no transactions are observed.

Fig. 1 Prices and submitted beliefs for homogeneous information events. The first, second and third rows correspond to median prices for the true, Alt-NM and implausible assets, respectively, aggregating over all sessions. The header of each panel details the round, followed by the number of sessions and finally, the corresponding submitted beliefs in parenthesis. The solid and dash horizontal lines denote the FRE and PIE prices, respectively

Fig. 2 Prices and submitted beliefs for heterogeneous information events. The first, second, third and fourth rows correspond to median prices for the true, Alt-NM, Alt-M and implausible assets, respectively, aggregating over all sessions. The header of each panel details the round, followed by the number of sessions and finally, the corresponding submitted beliefs in parenthesis. The solid and dash horizontal lines denote the FRE and PIE prices, respectively
Since all events of the form x(s) are a one-to-one mapping to assets, we will sometimes use both terms interchangeably. For any true event
 , define the alternative event as the non-true event to which traders assign a positive posterior given their private information at the start of the market. Since this will differ amongst the minority and non-minority traders, we use Alt-M and Alt-NM to denote the alternative event for the former and latter, respectively. Finally, for any true event, define the implausible events as those which all traders assign zero posterior to given their private information at the start of the market. For example if
 , then assets 0, 1, 2 and 3 are the implausible, Alt-NM, true, and Alt-M assets, respectively. If
 , then assets 0 and 1 are the true and Alt-NM assets, respectively, while assets 2 and 3 are the implausible assets.
Figures 1 and 2 present the median
 and submitted beliefs for homogeneous and heterogeneous private information events, respectively. The rows in each figure correspond to prices for the true, Alt-NM, Alt-M, and implausible assets. The header of each panel details the round, followed by the number of sessions which data is pooled from and the corresponding mean submitted belief in parenthesis. The solid and dash horizontal lines on each panel detail the FRE and PIE prices, respectively. For example, the top left panel of Fig. 1 corresponds to the the median
 of the true asset over the first round. The header shows that the round-1 true event was homogeneous in three of the seven sessions, and that 42% of subjects’ submitted beliefs corresponded to the true event.
There are several indications of learning over the ten rounds. We first consider purchases at a price of above 100 ECU. Such purchases might seem ‘irrational’ given that the maximum value of any asset is 100 ECU. Note, however, that this is not necessarily the case. For example, a trader might be willing to buy an asset she knows to be worthless at a price of 120 ECU, if she believes that this will influence the beliefs of other traders and enable her to sell five units of the same asset at a price of 30 ECU, or if she believes that she will be able to resale the asset at a higher price. We find that 19% of all purchases in the first five rounds were at a price of above 100 ECU, decreasing to 9% of all purchases in the last five rounds. Furthermore, whilst 79% of subjects made a seemingly irrational purchase at least once in the first five rounds, only 35% did so in the last five rounds. See the “supplementary Appendix” for more details.Footnote 25 Importantly, the persistence of such purchases suggests that there are still some subjects who behave like noise traders (e.g., De-Long et al. Reference De-Long, Shleifer, Summers and Waldmann1990).
Turning our attention to price dynamics, we observe that the true asset often transacted at close to 100 ECU. Consistent with the FRE and PIE predictions, prices of the implausible and Alt-M assets are converging towards zero, but only in rounds 6–10. Finally, prices for the Alt-NM asset seem to converge towards 100 ECU in rounds 1–4, 50 ECU in rounds 5–6 and finally, 0 ECU in rounds 7–10. To acknowledge the role of experience, we separate the data in the following analyses into ‘Inexperienced’ (rounds 1–5) and ‘Experienced’ (rounds 6–10) subjects.Footnote 26
In the following, we will first address RQ1, investigating whether Arrow–Debreu markets can be successful at aggregating dispersed private information into prices and revealing the true event. Orthogonal to this, we will also investigate whether the nature of information aggregation might be dependent on the information structure, more specifically, whether price and belief convergence differ between homogeneous and heterogeneous events. Finally, we study the behaviours of minority subjects to investigate RQ2.
4.1 Information aggregation
Our approach seeks to investigate the question of information aggregation from three different angles. Since relative asset prices can be interpreted as the markets’ prediction about the true event, we will first investigate whether the markets are often correct (i.e., the true asset is priced higher than the other assets). Thereafter, we will focus on the issue of arbitrage opportunities, such as when prices of the various assets do not sum up to 100 ECU. The intuition here is that subjects may learn about the true event at different t, resulting in disagreements and consequently arbitrage opportunities. However, such arbitrage opportunities should also be eliminated if information aggregation is successful. Finally, we will benchmark the FRE against the PIE to examine if prices are relatively closer to either equilibria.
4.1.1 Relative prices
From Figs. 1 and 2, we note that prices for the Alt-M and implausible assets are consistently lower than those for the Alt-NM and true assets. Indeed, transactions of the former two assets are also relatively less frequent. These observations are helpful since they suggest that markets often excluded the Alt-M and implausible assets as candidates for the true event. In this case, our analysis can focus on the relative prices of the Alt-NM and true assets.
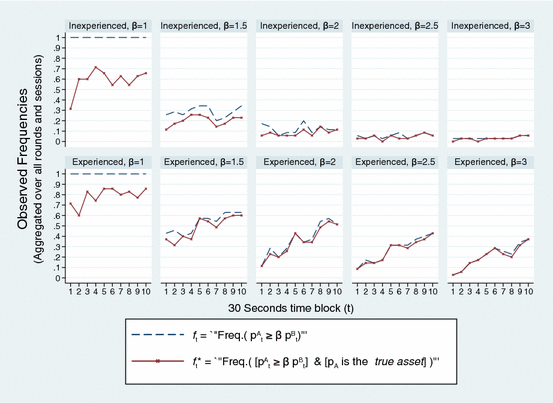
Fig. 3 Highest and second highest price assets. Assets A and B are the highest and second highest price assets at window t, respectively, with correspond prices
 and
and
 . The constant
 captures the extent to which
 is higher than
 . For a given
 ,
,
 shows the frequency to which the market has “picked a true event” and
 the frequency to which the market is correct. Specifically, for
 ,
,
 is the proportion of time in which the prices reveal the underlying true event
To make such comparisons, we will define assets A and B as the highest and second highest priced assets at time window t, respectively, with the corresponding prices
 and
and
 .Footnote 27 We derive the following two frequencies for some
 :
:
-
:
-
The frequency to which
at window t. -
:
-
The frequency to which
conditional on A being the true asset at window t.


For
 ,
,
 reflects the proportion of markets in which the true asset was priced higher than the other assets. Thus,
 measures the proportion of times in which the final prices reveal the true event. This happens overall in 52 of the 70 (74.3%) markets included in the experiment, or 29 of the 35 (82.86%) markets with experienced subjects. In each of the final four rounds, final prices revealed the true event in six of the seven sessions.
Values of
 larger than 1 capture the extent to which asset A is priced higher than asset B. Intuitively,
 captures the markets’ candidate true asset at time t given the criterion
 . For example when
 , then
 details the ratio of observations which the price of asset A is at least twice that of asset B in window t—data aggregated over all sessions. In this case,
 can be interpreted as the frequency to which the markets are correct (e.g., the frequency to which the true asset is priced at least
 times higher than the Alt-NM asset at time t). Inversely,
 details the frequency to which the markets are incorrect.Footnote 28
Figure 3 details the
 and
and
 for
for
 .Footnote 29 A few observations are apparent from the figure. First, for
 ,
,
 is very close to
 , implying that traders are sometimes incorrect in identifying the true asset, but rarely by a large margin. Alternatively, when markets clearly favour one asset over the others, they are almost always correct.
Second, experience has a strong effect on information aggregation. When subjects are inexperienced,
 is approximately 0.35 and 0.10 when
 and
and
 , respectively, suggesting that final trading prices do not discriminate between the assets by much. Furthermore, the plots are rather flat, indicating that discrimination doesn’t improve by much across the trading period. For experienced subjects, in contrast,
 and
and
 are very close to each other. Discrimination clearly develops as trade proceeds, as reflected in the upwards trends in the plots, culminating in
 at approximately 0.60 and 0.51 when
 and
and
 , respectively. The markets were, therefore, quite efficient in discriminating between the true asset and the other assets, with the true asset priced at at least twice the other asset in 51% of all observations.
4.1.2 Arbitrage opportunities
To study arbitrage opportunities, we define
 as the sum of al prices at window t.Footnote 30 The thick black line on Fig. 4 plots the median
 over all sessions. Here, we clearly observe
 to be decreasing with t for both inexperienced and experienced subjects, indicating that arbitrage opportunities are reduced with t.Footnote 31 Are they ‘eliminated’ at the end of the market?

Fig. 4 Median
 over all sessions. The header of each panel details the round. The variable
 describes the sum of all prices at window t. Arbitrage opportunities are defined to arise when

Table 2 Summary statistics for
 and
and


|
Variables:
|
||||
|---|---|---|---|---|
|
Variable |
Inexperienced |
Experienced |
||
|
|
|
|
|
|
|
Panel A: Data aggregated by sessions |
||||
|
Session 1 (mean) |
248 |
− 1 |
143 |
4 |
|
Session 2 (mean) |
134 |
6 |
80 |
13 |
|
Session 3 (mean) |
98 |
3 |
86 |
4 |
|
Session 4 (mean) |
353 |
− 4 |
183 |
− 6 |
|
Session 5 (mean) |
314 |
0 |
141 |
− 1 |
|
Session 6 (mean) |
190 |
− 3 |
103 |
13 |
|
Session 7 (mean) |
175 |
− 16 |
98 |
10 |
|
All sessions (mean)a |
216** (n = 35) |
− 3 (n = 35) |
119(n = 35) |
5* (n = 35) |
|
Wilcoxon Signrank Null |
||||
|
|
|
|
||
|
Null:
|
|
|
||
|
Panel B: Data aggregated by homogeneous and heterogeneous events |
||||
|
Homogeneous (mean) |
277 (n = 7) |
− 3 (n = 7) |
112 (n = 10) |
0 (n = 10) |
|
Heterogeneous (mean)b |
201 (n = 28) |
− 2 (n = 28) |
122 (n = 25) |
7 (n = 25) |
|
Mann–Whitney (Homo vs. Hetero) |
|
|
|
|


The variable
 describes the sum of all prices at window t. The variable
 describes the difference between the mean absolute deviation of prices from the PIE (
 ) and FRE (
 )
)
aAggregating over all sessions, we use the fixed effect model to regress
 (
(
 ) over a constant, where
 and
and
 imply that the constant is significantly different from 100 (0) at the 1 and 5% levels, respectively
bAggregating over all sessions, we use the fixed effect model to regress the dependent variable (
 or
or
 ) over a constant and a situation dummy for Heterogeneous information events.
 and
and
 imply that the situation dummy is significantly different from zero at the 1 and 5% levels, respectively
To study this, we focus on the prices at window
 . Panel A of Table 2 details the mean
 apportioned by sessions and experience. We clearly observe
 to be higher than 100 for inexperienced subjects. Indeed, aggregating over all sessions, we find
 to be significantly greater from 100 (Signrank,
 ,
,
 observations) for inexperienced subjects. This clearly suggests that arbitrage opportunities are still apparent at the end of the market.
The picture is nuance for experienced subjects. Firstly, we observe some heterogeneity amongst the sessions, with
 be noticeably different from 100 for sessions 1, 4 and 5 and less so for sessions 3, 6 and 7. Aggregating over all sessions, we do not find
 to be significantly different from 100 for experienced subjects (Signrank,
 ,
,
 ).Footnote 32 We thus cannot exclude the possibility that arbitrage opportunities are eliminated at the end of the market.
4.1.3 Deviations of prices from the FRE and PIE
To benchmark the FRE against the PIE, we compute the mean absolute deviations of
 from the former and latter, henceforth known as
 and
and
 , respectively.Footnote 33 Note that the symmetrical nature of the FRE and PIE imply that
 and
and
 will often be close and at times even identical.

Fig. 5 Median
 over all sessions. The header of each panel details the round. The variable
 describes the difference between the mean absolute deviation of prices from the PIE (
 ) and the mean absolute deviation of prices from the FRE (
 ). A positive and negative
 indicate that prices are relatively closer to the FRE and PIE, respectively
Given the above, we define
 as the difference between both mean absolute deviations at window t. Interpretations here should be straightforward: A positive (negative)
 implies that prices at window t are relatively closer to the FRE (PIE). This relationship also implies that
 will converge to 25 (− 25) as prices converge to the FRE (PIE). Therefore, any relative measure between the FRE and PIE only needs to focus on the sign of
 . Information aggregation is also expected to be a dynamic process from traders continuously about the true event from prices. Furthermore, the reasoning model in Sect. 3.3 predicts that the path of convergence to the FRE will also go through the PIE. In this case, we should typically expect
 to start in the negative region and increase with t towards the positive region. However, the rate of increase is also expected to decrease with t.
The construct of
 is also convenient given that variations will only depend on the prices of the true and Alt-NM assets, the two most frequently traded asset types. That is, for fixed prices of the true and Alt-NM assets, variations to the implausible and Alt-M assets will not influence
 given that such variations shift the
 and
and
 by the same magnitude.
The thick solid line on Fig. 5 details the median
 , aggregating over all sessions. For inexperienced subjects, we observe
 to often be zero (i.e., prices are not getting closer to the FRE nor the PIE with t.) This is consistent with the observations in Sect. 4.1.1, where we find that prices for the true and Alt-NM assets are often not very different. For experienced subjects, we often observe
 to be negative at the start of the round and increase progressively over t. To see the evolution of prices more formally, we regress
 on the time trend t and
 . The fixed-effects coefficient estimates for experienced and inexperienced subjects are reported as follows (robust standard errors in parenthesis)Footnote 34:

The negative intercept term in both regressions imply that prices towards the start of the round are significantly closer to the PIE. For inexperienced subjects, the coefficient estimates for t and
 are not significant at the 10% level. In contrast, the t coefficient for experienced subjects is both significant (
 ) and positive. The
 coefficient for experience subjects is negative but not significant (
 ). The estimates therefore suggest that only for experienced subjects do prices seem to move away from the PIE towards to the FRE.
To test whether markets are indeed successful at aggregating dispersed private information and revealing the true event through the equilibrium prices, we now focus on the end of the markets (i.e., window
 ). Panel A of Table 2 details the mean
 apportioned by sessions and experience. Aggregating over all sessions, we do not find
 to be significantly different from zero (Signrank,
 ,
,
 ). In contrast, we find
 to be positive and significantly (Signrank,
 ,
,
 ) different from zero for experienced subjects.Footnote 35 Together with the observations from Sects. 4.1.1 and 4.1.2, the evidence here leads us to our first result.
Result 1
For experienced subjects we find that (1) Markets frequently price the true asset significantly higher than the other assets, (2) There is no significant evidence of arbitrage opportunities at the end of the round, (3) Prices move towards the FRE and away from the PIE within a round, and (4) End of round prices are significantly closer to the FRE relative to the PIE. These observations do not hold for inexperienced subjects. The evidence therefore suggests that markets can be successful at information aggregation, even when the task is challenging and requires market participants to employ counterfactual reasoning, but only when market participants have experience with the trading mechanism or market design.
For further robustness checks, we also employ the approach of Plott and Sunder (Reference Plott and Sunder1988) and Forsythe and Lundholm (Reference Forsythe and Lundholm1990) where only the last (P1 price) and last 5 (P5 prices) transactions prices of each asset are considered. For inexperienced subjects, we find P1 (Signrank,
 ,
,
 ) and P5 (Signrank,
 ,
,
 ) prices to be somewhat closer to the PIE. In contrast, P1 (Signrank,
 ,
,
 ) and P5 (Signrank,
 ,
,
 ) prices are significantly closer to the FRE for experienced subjects.
4.1.4 Homogeneous versus heterogeneous information events
Building on Result Footnote 1, we now investigate whether the information aggregation properties of markets depend on the information structure (i.e., homogeneous or heterogeneous events).Footnote 36
First consider those instances where the true and Alt-NM assets are the highest (A) and second highest (B) priced assets at window t. Focusing on window
 , we compute the ratio
 , the relative price of the true over the Alt-NM asset. This ratio does not differ significantly between homogeneous and heterogeneous events for inexperienced (Mann–Whitney,
 ,
,
 ) and for experienced (Mann–Whitney,
 ,
,
 ) subjects.
Turning our attention to arbitrage opportunities, Fig. 4 details the median
 for homogeneous and heterogeneous events, apportioned by rounds. With the exception of round 4, there does not seem to be any obvious differences in
 for both events. Restricting our analysis to prices at the end of the round, Panel B of Table 2 details the mean
 apportioned by events and experience. Aggregating over all sessions, we do not find
 for homogeneous and heterogeneous events to be significantly different amongst inexperienced (Mann–Whitney,
 ,
,
 ) and experienced (Mann–Whitney,
 ,
,
 ) subjects. Similarly, we do not find
 for experienced subjects to be significantly different from 100 for homogeneous (Signrank,
 ,
,
 ) and heterogeneous (Signrank,
 ,
,
 ) events.
Finally, Fig. 5 details the
 for homogeneous and heterogeneous events, apportioned by rounds. Now with the exception of round 5, there does not seem to be any differences in
 amongst both events. Panel B of Table 2 also provides some summary statistics for
 over the homogeneous and heterogeneous events. We again do not find any significant differences in
 for inexperienced (Mann–Whitney,
 ,
,
 ) and experienced (Mann–Whitney,
 ,
,
 ) subjects. This leads us to the second result.
Result 2
For inexperienced and experienced subjects, we find that homogeneous and heterogeneous events do not result in significant end of round differences in (1) The ratio of highest and second highest priced assets, (2) Arbitrage opportunities, and (3) Differences in the mean absolute deviation of prices from the PIE and FRE. This suggests that the information aggregation properties of markets are independent of whether traders are endowed with homogeneous or heterogeneous private information about the true event.
4.2 Post-market stage
Turning our attention to the post-market stage, we define a subject to be correct if her submitted beliefs correspond to the true event, i.e.,
 . The corresponding proportions of correct inexperienced and experienced subjects are 0.51 and 0.71, respectively.
Given that both PIE and FRE make precise predictions as to the submitted beliefs of minority and non-minority traders, it seems natural to investigate how such predictions match subjects’ submitted beliefs. To do so, we compute the mean absolute deviations of the submitted beliefs from the PIE and FRE beliefs.Footnote 37
Submitted beliefs for inexperienced subjects are significantly closer to the PIE prediction (Signrank,
 ,
,
 ). This may not be surprising given that Result Footnote 1 suggests that the true event is unlikely to be reflected in prices. It is perhaps more surprising that beliefs submitted by experienced subjects are not significantly closer to either the FRE or the PIE prediction (Signrank,
 ,
,
 ) despite the fact that subjects could learn the true event by looking at the closing market prices. This result reveals that individual learning is not a necessary condition for successful information aggregation in prices. That is, it is possible for market prices to reflect the true event even when a sizeable proportion of traders remain uninformed of the true event.
This result is consistent with the marginal trader hypothesis (e.g., Forsythe and Lundholm Reference Forsythe and Lundholm1990), which posits that it is sufficient to have a few sophisticated traders that understand how market prices are related to the states of the world in order to drive prices towards the FRE. We explore this possibility by using the post-market stage to identify the ‘sophisticated’ traders independent of their market behaviour. We define expert traders to be those who submitted a correct belief in at least nine out of the ten markets they participated in. This categorization yields 24% (20 of 84) expert traders.Footnote 38 Table 3 presents mixed-effects regressions comparing the expert traders with the other traders. Columns (1) and (2) reveal that expert traders made larger profits, and held higher share of the true asset at the end of trade. Looking at the expert traders’ purchase decisions, we see in Columns (3) and (4) that experts were more judicious in their purchase decisions, making fewer purchases, and being more likely to purchase the true asset compared to non-experts. The MAD in column (6) of the table, defined as the mean absolute deviation of the trader’s purchases from the FRE, shows that the experts’ mean purchase price is indeed significantly closer to the FRE price. To further test whether expert traders were more likely to push prices closer to the FRE, we look at how prices move with each purchase made by the trader.Footnote 39 We define convergent purchases to be purchases made at a price that is at least as close to the FRE price as in the preceding transaction of the same asset.Footnote 40 Column (5) in Table 3 details the share of convergent purchases out of the trader’s total purchases in the round. Close to 61% of non-experts’ purchases do not move the price away from the FRE compared to 65% for expert traders. This difference increases to nine percent points and becomes significant at the 10% level if we restrict the analysis to experienced traders only.
Table 3 Expert traders

|
(1) |
(2) |
(3) |
(4) |
(5) |
(6) |
|
|---|---|---|---|---|---|---|
|
Profits |
True in inventory |
Total purchases |
Proportion true |
Proportion convergent |
MAD |
|
|
EXPERT |
196.048a (86.193) |
9.814b (3.946) |
− 2.429c (1.325) |
0.161a (0.040) |
0.044 (0.029) |
− 8.651a (2.240) |
|
Round |
− 0.038 (0.157) |
− 0.481a (0.107) |
0.008b (0.004) |
0.004 (0.004) |
− 4.650a (0.290) |
|
|
Constant |
553.322a (24.561) |
22.254a (0.836) |
12.940a (1.333) |
0.352a (0.040) |
0.584a (0.031) |
73.898a (3.099) |
|
N |
840 |
840 |
840 |
553 |
768 |
768 |
Mixed-effects regressions with random effects for subjects and robust standard errors clustered at the session level. Note that profits do not change across rounds as trade is zero-sum
a

b

c

Returning to the comparison of homogeneous and heterogeneous events, we find that inexperienced subjects are more likely to submit a correct belief in a heterogeneous event than in a homogeneous event (0.69 vs. 0.39, Fisher exact,
 ). With experience, however, we see a substantial improvement even in the homogeneous events. Experienced subjects are roughly equally likely to be correct in both event types, submitting correct beliefs in 0.73 and 0.65 of instances for the heterogeneous and homogeneous events, respectively (Fisher exact,
 ).Footnote 41 It thus appears that homogeneous events pose greater difficulty for traders to discover the true state of the world. Notwithstanding, this does not impede price convergence. This conclusion should be taken cautiously, however, as the post-market beliefs may be influenced by the ex-ante low probability of the homogeneous events.Footnote 42 Result Footnote 3 summarises:
Result 3
Inexperienced traders remain uninformed about the true state of the world. Although with experience market prices converge to the FRE prices, traders remain largely uninformed. There is some evidence that a few sophisticated traders both succeed in discovering the true state and are instrumental in driving prices towards the FRE.
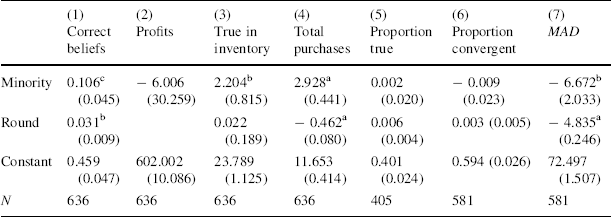
4.3 Minority report
The reasoning model of Sect. 3.3 predicts that minority traders in the heterogeneous events learn about the true state before the non-minority traders, and are influential at driving prices towards the FRE. In this section we test these predictions using the market behaviour and submitted beliefs of minority traders.
Table 4 Minority traders
|
(1) |
(2) |
(3) |
(4) |
(5) |
(6) |
(7) |
|
|---|---|---|---|---|---|---|---|
|
Correct beliefs |
Profits |
True in inventory |
Total purchases |
Proportion true |
Proportion convergent |
MAD |
|
|
Minority |
0.106c (0.045) |
− 6.006 (30.259) |
2.204b (0.815) |
2.928a (0.441) |
0.002 (0.020) |
− 0.009 (0.023) |
− 6.672b (2.033) |
|
Round |
0.031b (0.009) |
0.022 (0.189) |
− 0.462a (0.080) |
0.006 (0.004) |
0.003 (0.005) |
− 4.835a (0.246) |
|
|
Constant |
0.459 (0.047) |
602.002 (10.086) |
23.789 (1.125) |
11.653 (0.414) |
0.401 (0.024) |
0.594 (0.026) |
72.497 (1.507) |
|
N |
636 |
636 |
636 |
636 |
405 |
581 |
581 |
OLS regressions with subject fixed effects and robust standard errors clustered at the session level. Only data from the heterogeneous events is included. Note that profits do not change across rounds as trade is zero-sum
a

b

c

Table 4 provides some evidence supporting the model’s predictions. Comparing behaviour in the heterogeneous events within subjects, we find that when (exogenously) placed in the minority role, traders are better informed, as measured by post-market beliefs (
 for the marginal effect in the regression reported in Column (1)). Column (4) shows that minority traders are more active, making 9% more purchases than non-minorities. They are, however, not more likely to purchase the true asset or to make a convergent purchase, as seen in Columns (5) and (6). Notwithstanding, Column (7) reveals that minority traders buy at closer to the FRE price, suggesting that when minority traders do make a convergent purchase, their purchase price moves a larger distance from the preceding traded price towards the FRE price. Finally, Columns (2) and (3) show that, at the end of trade, minority traders hold a larger share of the true asset in their inventory, but do not make a larger profit overall compared to rounds in which they are cast in the non-minority role. Result Footnote 4 summarises these observations.
Result 4
Relative to non-minority subjects, minority subjects (1) Are significantly more likely to be correct, (2) Hold a significantly greater proportion of the true asset in their inventory and (3) Purchase additional assets at prices significantly closer to the FRE. This provides some tentative evidence that minority subjects are informed about the true event before the others and are influential at driving prices towards the FRE.
If minority traders are better informed, why are they unable to leverage their knowledge to purchase the true asset at a discount and thus improve their payoffs? A central claim of the efficient market hypothesis (e.g., Fama Reference Fama1970) is that if markets are strong-form efficient, then any trader seeking to exploit his private information immediately reveals the same information from his demand of assets, thus negating any possible gains. Furthermore, competitive bidding between minority subjects might also reduce the scope for such gains.

Fig. 6 Coefficient estimate of
 . We regress subjects’ liquidation value at window t on a constant and situation dummy for minority subjects (
 coefficient). The above details the estimate of
 at each t
The above suggests that whilst minority traders may initially be able to profit their knowledge of the true event, such gains will eventually be eroded over time. To study the development of minority gains over time , we compute the liquidation value (i.e., how much the portfolio of cash and assets is worth after the loan of 5000 ECU is returned) of the trader’s portfolio at window t. We then regress for each window t, the liquidation value on the minority subjects, using fixed subject effects with session level clustering. The minority dummy coefficient,
 , thus captures the expected difference in liquidation value between the minority and non-minority roles at window t. Figure 6 plots the estimate for
 at each window t. The hump shape distribution of
 suggests that the liquidation value of a minority trader increases during the early periods of the round (i.e., between windows 2–5), with the gap disappearing as trade proceeds. However, the differences are not significant at the 5% level.
5 Conclusion
This study is motivated by the question as to whether markets are able to aggregate dispersed private information about the true state of the world into prices. We consider an experimental design which allows us to endow traders with homogeneous and heterogeneous private information about the true event. With this framework, we advance a simple model which shows that markets converge to the fully revealing rational expectations equilibrium for both homogeneous and heterogeneous cases, indicating that the true event will be reflected in prices. However, the process of convergence to the FRE is challenging and requires traders to perform counterfactual reasoning. A post-market stage allows us to estimate individual learning independent of market activity, and to correlate learning and market behaviour.
We find that markets can be successful at aggregating information, but only when market participants have experience with the trading mechanisms. When traders are experienced, the market prices successfully aggregate and reflect the true state, even when traders start out with induced homogeneous beliefs. The requirement for counterfactual reasoning does not appear to impede market convergence. Although the prices reveal the true state, individual learning is strongly constrained. Consistent with the marginal trader hypothesis, we find that a limited number of sophisticated traders is sufficient to drive market prices towards the rational expectations equilibrium. The role traders play in price convergence depends both on endogenous characteristics and on information asymmetries. The last point suggests that even when some traders gain insider knowledge, markets can efficiently price this knowledge.
Taken together, this paper extends the pioneering work by Plott and Sunder (Reference Plott and Sunder1988) on information aggregation in an environment which we believe to be significantly more complicated. The new design allows us to explore questions of information structure complexity and symmetry, and compare market results to directly elicited post-market beliefs. We conclude that markets composed of experienced traders are able to successfully aggregate dispersed information even in a challenging environment, and even if only a minority of the traders become fully informed in the process.
Acknowledgements
We thank Ariel Levy, Emma-Riikka Myllymäki, and participants at the ESA 2016 international meeting in Jerusalem, Experimental Finance 2015 in Nijmegen, Exeter Prize 2016 workshop and World Finance Conference 2017 in Sardinia for helpful comments and discussion. The authors would like to thank Shyam Sunder whose suggestions motivated this experimental research.
Funding
Funding was provided by University of Exeter.


 ptA
ptA ptB
ptB β≥1
β≥1 ptA
ptA ptB
ptB β
β ft
ft ft∗
ft∗ β=1
β=1 ft∗
ft∗
 SUMt
SUMt SUMt=∑αp¯tα
 SUMt≠100
 SUM10
SUM10 DIFF10
 DIFFt
DIFFt DIFFt=MADtP-MADtF
 MADP
MADP MADF
MADF DIFFt
DIFFt


 β1,t
β1,t β1,t
β1,t β
β


 Open access