


1 Introduction
Defaults can strongly change behavior. The evidence comes from opt-out interventions where no substantial post-default effort is required to change the target outcome.Footnote 1 Think of defaulting individuals into a retirement savings plan with automatic contributions: this serves to attain the target outcome and requires no further action of the defaulted individual. In fact, none of the outcomes in the meta-analysis of defaults by Jachimowicz et al. (Reference Jachimowicz, Duncan, Weber and Johnson2019) require substantial or repeated investment of time and effort. In such settings, staying with the default and not taking further post-intervention action is sufficient to reach the target outcome. However, life is full of tasks that require the provision of effort over longer periods of time once the individual has taken up the task. Nothing is known about the effectiveness of defaults in such settings. If switching from opt-in to opt-out can elicit post-intervention effort provision, defaults could thus provide a policy option in many domains where they have so far not been employed.
It is far from clear that defaults will be effective in these settings, due to a lack of what have so far been considered defining characteristics of successful default interventions: a reduction in the future cost of performing the target behavior, and a short lag between intervention and target behavior (see Rogers & Frey, Reference Rogers and Frey2015). Recall the automatic savings plan: it immediately initiates the target behavior of saving and avoids the effort and attention costs otherwise needed to continue saving in the future. While, in order to achieve long-term outcomes, subjects bear recurring monetary costs in the form of periodic payments, these costs do not require the active initiative of the decision maker to invest additional time or effort after taking on the task, but rather occur automatically.Footnote 2 These features are absent in many domains, and it is thus an important question whether defaults can elicit effort provision and the attainment of effortful target outcomes downstream.
Tasks that require effort and rely on voluntary participation span various domains. These domains include on-the-job training and training programs for the unemployed, the pursuit of higher-level corporate goals such as diversity, inclusion, and equity, the participation in volunteer work, or the engagement of individuals in extracurricular activities within the education domain. However, voluntary take-up of labor market training programs is often low, particularly among those who need them most (Sousa-Ribeiro et al., Reference Sousa-Ribeiro, Sverke, Coimbra and De Witte2018; Salamon et al., Reference Salamon, Blume, Orosz and Nagy2021; Scherer et al., Reference Scherer, Howard, Tondeur and Siddiq2021). The successful implementation of higher-level corporate goals depends on management’s willingness to engage in coaching and leadership development (Cox & Lancefield, Reference Cox and Lancefield2021). Many societies face shortages in volunteer work, especially given aging populations (Niebuur et al., Reference Niebuur, van Lente, Liefbroer, Steverink and Smidt2018), and policy measures to increase participation are in demand. Individuals of lower social status often do not participate in extracurricular activities, thus forgoing the potential to enhance social mobility and bridge existing “engagement gaps” (Snellman et al., Reference Snellman, Silva, Frederick and Putnam2015).
Given the aforementioned challenges, opt-out interventions hold promise for yielding beneficial outcomes by defaulting individuals into participation. Our paper is the first to investigate the effectiveness of defaults in a setting that is structurally similar to the above described examples, in the economically and socially important area of higher education. This makes our paper also the first to evaluate whether defaults can directly affect choices and outcomes in education.Footnote 3
Our intervention changes the choice architecture when students sign up for exams. Unlike the American or British system, where students sign up for courses (with exam participation compulsory), many European universities require students who attend a course to actively sign up for the exam if they want to take it (opt-in). Our intervention at a German university changes the standard sign-up rule for exams from an opt-in to an opt-out rule, i.e., students are automatically enrolled for scheduled exams but can drop them if they want to.Footnote 4 In a first step, we assess whether the opt-out rule increases the number of exam sign-ups at the beginning of the semester, i.e. whether standard default effects can be found in an education setting. We use the term standard default effect when the desired outcome can be achieved without expending substantial effort, i.e., even if the decision maker stays largely passive. Opting into more exams is, however, not sufficient for staying on track to graduation; rather the exams need to be taken and passed.Footnote 5 The problem is the same in universities and colleges around the world. For example, in the US and other OECD countries less than 40% of bachelor students graduate within the scheduled time (see OECD, 2019).Footnote 6 In a second step, we thus go beyond standard default effects and assess effects on exam participation and passing—outcomes which require considerable and repeated post-intervention investment of time and effort in the form of participating in lectures and studying for the exam. We label these effects downstream default effects.
We conduct two separate preregistered field experiments. In the first experiment, the treatment consists of signing up first-semester business administration students for all exams that the curriculum of their program recommends in the first semester. The university recommendation corresponds to the standard 30 credits courseload in the European university system.Footnote 7
 Footnote 8 In the following we refer to this approach as a broad default as it affects not only a single course or exam and aims to have students stay on track by collecting all first semester credits.Footnote 9 The second experiment is a conceptual replication, where we examine the effect of a default that focuses only on one specific effortful task. Due to this focus on one task, we call the second intervention targeted default experiment. It is conducted with a pooled cohort of Business Administration (BuA) and International Business (IB) students and automatically signs up second semester students only for the statistics exam, a second semester principles class that is viewed as challenging.
Our first finding is that standard default effects can be observed when the target task requires substantial effort. The broad and the targeted default increase exam sign-ups after the sign-up period by 0.27 exams and 5 percentage points (pp), respectively. With a broad default this effect on sign-ups vanishes by exam day, whereas it persists with the targeted default (6 pp). We discuss potential reasons in the paper.
Beyond the standard default effects, we find that further downstream, when investment of time and effort is necessary to alter outcomes, the broad default has no effect. The same is true for the targeted default, when the pooled BuA and IB sample is considered. Given that the idea of nudges is to leave the choices of those with strong preferences unchanged, these interventions tend to be effective for specific groups. As Sunstein (Reference Sunstein2017) puts it: “[...] the aggregate effect may tell us far less than we need to know. [...] sub-analyses can reveal that the nudges are highly effective on distinct subpopulations, during distinct time periods, or in specific contexts”.Footnote 10 We therefore further analyze the targeted default in heterogeneity analyses that were not part of the preregistration.
First, since the randomization was stratified by study program, we evaluate differences between BuA and IB effects. This facilitates a direct comparison with the broad default (which included BuA only). At the same time, differences between BuA and IB in student characteristics, program size, and study regulations naturally suggest this subgroup analysis. We find that for BuA students the targeted default also significantly increases participation by 6.5 pp. The point estimate of the effect on passing is positive (3.6–3.8 pp), but imprecisely measured. For IB students, we only observe standard default effects. We discuss reasons for the difference in effects between the study programs in Sect. 3.3.1.
Our second subgroup analysis builds on recent research showing that (i) in the lab the alignment of interests between defaultee and default setter strongly predicts default effectiveness (Altmann et al., Reference Altmann, Falk and Grunewald2022); (ii) high responsiveness is linked to larger nudge effects (Heffetz et al., Reference Heffetz, O’Donoghue and Schneider2022). Within the much larger group of BuA students, we therefore also focus on the group of responsive students, which comprises those who responded to unrelated requests from the university to take part in a survey collecting feedback on students’ study experience (40% of students responded). Responding to the survey request shows that these students are open and responsive to communication from the university, and motivated to provide feedback. We argue that the interests of these students are likely also better aligned with the interests of the default setter (the university) than the interests of those who are unresponsive to the requests. Specifically, we argue that the university and the responsive students have aligned interests when it comes to (quick) completion of the program. We thus expect the exam opt-out rule to be more effective for the responsives.
We find that for responsives in addition to standard default effects (up to 8 pp more sign-ups), the automatic sign-up also increases (successful) task completion, i.e. participation (16.5 pp) and passing (11.2–12.2 pp). On top of the standard default effects on sign-ups, for responsives the default can therefore have strong effects on downstream outcomes which require substantial post-treatment investments from the individual.
It is interesting that exam participation of responsives increases by more than just their increase in sign-ups (16 pp vs. 8 pp). Our results indicate that this is related to a large reduction in exam no-shows among the treated responsives. This could also be relevant on a more general level, because it indicates that defaults may positively affect the outcomes downstream even for individuals who would have signed up under an opt-in rule anyway. The potential implication is that not all sign-ups are equally binding: own sign-ups might result in no-shows at a higher rate than sign-ups initiated by the university.
The finding that the default seems to change outcomes for responsive students does not necessarily mean that only strong performers benefit. In fact, our results from the third heterogeneity analysis may indicate that responsiveness is a category distinct from ability: among the responsives, those who benefit most had a lower first semester performance. For these students our estimates suggest much larger effects on sign-up, participation and passing of the statistics exam. Among the non-responsive students we see a similar pattern concerning sign-ups: the lowest performers in the first semester have the highest increases in sign-ups. However, the consequences of the increased sign-ups downstream seem to differ vastly between non-responsive and responsive students. For the low-achieving responsive students the increase in sign-ups may translate into a higher rate of participation and passing. For the low-achieving non-responsive students, on the other hand, increased sign-ups seem to not turn into higher participation but they might rather increase the rate of failed exams due to no-shows. Defaults might thus be beneficial to low-achieving responsives but they do not help (and might even hurt) low-achieving individuals who are not responsive in the first place.
In the survey that we use to identify responsive individuals, information is obtained that can help understand the mechanism behind the default effects. The data shows that effort is the mechanism behind the effects we see for responsives: in line with the positive effects on exam passing, automatic sign-up for the statistics exam increases attendance in the statistics course/tutorial and time spent preparing for statistics outside of class. This plausibly contributes to the increased pass rates we observe.
Because in the targeted default the automatic sign-up only affects one specific task (the statistics exam), it is also important to consider the entire universe of performance and check for potential substitution effects. We find no evidence that the responsives obtain a worse statistics grade or a lower overall semester grade point average, and no evidence that they sign up for fewer exams or obtain fewer credits in classes other than statistics—their observed response to the opt-out default can therefore be interpreted as a net positive effect.
Contribution to the literature This paper contributes to the literature in three main ways. First, our study investigates for the first time whether and under which conditions defaults can affect target outcomes that require substantial and ongoing post-treatment investment of time and effort by individuals. In contrast, the literature to date has focused on defaults that meet two main conditions: reduction in the future cost of performing a target behavior and a short lag between intervention and target behavior (see Rogers & Frey, Reference Rogers and Frey2015). For example, none of the 58 experiments (35 papers) included in the review article by Jachimowicz et al. (Reference Jachimowicz, Duncan, Weber and Johnson2019) require continuous and substantial investment of time and effort. In fact, only six of the studies need any post-intervention action, and, unlike attending class, studying, and taking an exam, all of these activities are one-off and demand very little effort (Chapman et al., Reference Chapman, Li, Colby and Yoon2010; Narula et al., Reference Narula, Ramprasad, Ruggs and Hebl2014) automatically schedule doctor’s appointments, Trevena et al. (Reference Trevena, Irwig and Barratt2006), Jin (Reference Jin2011), and Elkington et al. (Reference Elkington, Stevenson, Haworth and Sharwood2014) default people into survey participation, Loeb et al. (Reference Loeb, Radnitz, Keller, Schwartz, Marcus, Pierson and DeLaurentis2017) recruit individuals for a one-time behavior that benefits health).
Second, there is no research on whether defaults can directly affect academic choices and outcomes in education. The literature in this field has so far only indirectly targeted academic outcomes: Bergman et al. (Reference Bergman, Lasky-Fink and Rogers2020) use an opt-out rule to sign up parents of high-school students for a program in which they receive weekly text messages when their child’s performance drops. Automatic enrollment of parents subsequently also improves student achievement in terms of grades and course passing. Kramer et al. (Reference Kramer, Lamb and Page2021) investigate default effects on financial choices of students and find that automatic enrollment for education loans increases the likelihood of borrowing; this has no effects on academic performance. In a lab experiment, Cox et al. (Reference Cox, Kreisman and Dynarski2020) find that changing the default student loan repayment plan to the less risky option strongly increases choosing that plan.
Our result that changing the exam sign-up procedure in higher education from an opt-in rule to an opt-out rule leads to more sign-ups can be interpreted as the equivalent of standard default effects in other contexts, which require no post-intervention action of the defaulted person (e.g. Madrian & Shea, Reference Madrian and Shea2001; Johnson & Goldstein, Reference Johnson and Goldstein2003; Choi et al., Reference Choi, Laibson, Madrian and Metrick2004; Abadie & Gay, Reference Abadie and Gay2006; Dinner et al., Reference Dinner, Johnson, Goldstein and Liu2011). The magnitude of our effects is small compared to the literature on defaults (see, e.g., Jachimowicz et al., (Reference Jachimowicz, Duncan, Weber and Johnson2019); Mertens et al., (Reference Mertens, Herberz, Hahnel and Brosch2022)), consistent with the finding that behavioral interventions in general exhibit smaller effect sizes in education settings (see, e.g., Kraft, Reference Kraft2020; DellaVigna & Linos, Reference DellaVigna and Linos2022). Our study is also the first to show that for a specific group, defaults can improve downstream outcomes which require effort, and the first to show that in this group of responsive individuals important education outcomes benefit from the changed default.
Third, the finding that responsive students react particularly well to defaults contributes to the research on the mechanisms driving default effects. Recently, Altmann et al. (Reference Altmann, Falk and Grunewald2022) have shown in the lab that defaults are more effective in changing behavior when the interests of the choice architect and the decision maker are aligned.Footnote 11 Our results provide evidence from the field in support of these findings. Our study also contributes to the literature which investigates heterogeneous effects of behavioral interventions (see e.g., Sunstein, Reference Sunstein2017; Damgaard & Nielsen, Reference Damgaard and Nielsen2018; Jachimowicz et al. Reference Jachimowicz, Duncan, Weber and Johnson2019 or Mertens et al., Reference Mertens, Herberz, Hahnel and Brosch2022), specifically responsiveness and its consequences for the effectiveness of nudges (see, e.g., Heffetz et al., Reference Heffetz, O’Donoghue and Schneider2022 for a reminder setting).
The remainder of this paper is structured as follows: Sect. 2 reports the design, procedure, and results of the broad default intervention. Section 3 reports the same for the targeted default and explores mechanisms. Section 4 concludes.
2 Field experiment I: broad default
Both experiments were conducted at one of the largest universities of applied sciences in Germany.Footnote 12 The interventions were implemented and outcomes collected before any Corona-related restrictions.
The first experiment included the entire first-semester cohort of the bachelor’s program Business Administration (BuA). BuA is one of the largest programs offered at our university and also the most popular program in all of German higher education—roughly 8% of all first year students in German higher education choose BuA (Destatis, 2020).
2.1 Research design
Students in the BuA first-semester cohort were randomized into two exam sign-up regimes: opt-in (the standard procedure) and opt-out (automatic sign-up, i.e. the treatment group). Randomization was carried out by stratifying on high school GPA and balancing on the covariates displayed in Table A.1 in the Appendix Morgan and Rubin (Reference Morgan and Rubin2012).Footnote 13 The table shows that all variables are balanced between the control and the treatment group.Footnote 14
Students in the treatment group were automatically signed up for all six exams (= broad default) that the university recommends in the study plan for the first semester: Mathematics, Business Administration, Corporate Management, Accounting, Microeconomics, and Business Informatics.Footnote 15 Students are generally free to defer exams to later semesters without immediate consequences. Only Math and Business Administration are part of the orientation exams. If students do not sign up for and take the orientation exams in the first semester, these exams will count as failed.
The study plan is made salient by the university at the beginning of the semester, in introductory lectures, by tutors, in documents on the website and through the letter sent to the control group as well as the treatment group as part of the experiment (details below). The information is therefore familiar to all students in the control and treatment group and should not have any effects.
Students in the opt-out group could de-register from the exams they were signed up for. In the control group students had to actively sign up for exams themselves (opt-in), which is the standard procedure in German higher education.
2.1.1 Procedure
In the week before the semester we informed students in both the treatment and the control group about the exam registration procedure that applies to them (via postal mail and e-mail; the letters are displayed in the Online Material; a timeline of the broad default experiment is provided in Fig. A.1 in the Appendix). The letters for both the treatment and control groups also included an outline of the study plan for the first and second semester.
Students in the control group could sign up for exams online during a two-week period, three weeks into the semester. During the same time interval and via the same online tool, students in the treatment group had the opportunity to de-register from the exams they were automatically signed up for and could also sign up for additional exams. In the tables and figures we refer to this period as the sign-up period. Three weeks after the end of the sign-up period, during a week-long de-registration period students could withdraw from exams they signed up for (or were signed up for by default), but during this period they can not sign up for another exam instead. After this point, an exam registration can still be dropped if a doctor’s note is provided. A sign-up on exam day will be graded as failed if the student does not participate in the exam.
2.1.2 Outcomes
We study the process from exam sign-up to passing or failing the actual exams. An important distinction we make is between standard default effects and downstream effects. We call a standard default effect one where no further action is required by the individual to reach the desired outcome: in our setting the relevant outcome for the standard default effect is the number of exam sign-ups. We measure exam sign-ups at two points in time: (1) five weeks into the semester after the sign-up period and, (2) on the day of the exam.Footnote 16 Staying signed up does not require any post-default action or effort from the individuals, and a higher number of exam registrations can be considered desirable (as registration is a prerequisite for passing an exam).
Downstream effects go beyond the standard default effects, and we use the number of passed exams to measure them. Changing the number of passed exams requires significant post-intervention effort by students, in the form of studying and taking the exam.
To investigate potentially negative spillover effects on other performance dimensions we also preregistered to study treatment effects on the 1st semester GPA, failed exams and the overall number of acquired credit points (see Table 3). Failed exams comprise fails due to insufficient performance upon participation, fails due to no-shows, and failed exams due to non-sign-ups for orientation exams.Footnote 17
2.2 Results
The official recommendation of the university is that students in the first semester sign-up for, and pass the six exams mentioned in the study plan. Overall, only 81% of control group students sign up for all six exams (see Fig. A.2). This means that a few weeks into the first semester already about 19% of the students are not on track to graduate in the recommended time frame. Further downstream, at the end of the semester, the rate of successful task completion is substantially lower: only 38% pass all six recommended exams.
On top of the more general question whether defaults work when effort is required, from an education perspective, our intervention can prevent students from falling behind early on and keep them on track towards a timely and successful degree completion.Footnote 18 Signing up is a prerequisite for passing an exam and so we will first assess the effect the opt-out sign-up procedure has on the number of exams signed up for (standard default effect). We then evaluate whether a potentially higher number of exam registrations can lead to more passed exams (downstream default).
We report results based on the following OLS specification:

where
 denotes the outcome k for individual i.
 is a binary indicator for being randomized into the treatment group and
 identifies the effect of the opt-out sign-up rule. We provide estimates that control for the method of randomization (see e.g., Bruhn & McKenzie, Reference Bruhn and McKenzie2009), by reporting a preregistered specification using strata dummies
 , as well as a second preregistered specification that adds a covariate vector
 consisting of the balancing variables accounting for the ability and background of students (high-school GPA, gender, age, application day, enrollment day, German citizenship, and university semesters prior to the current study program).
2.2.1 Standard default effects
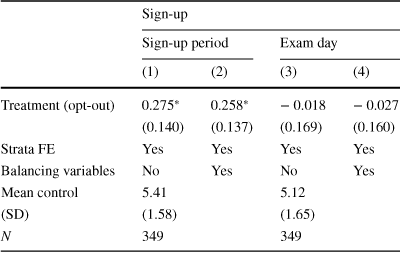
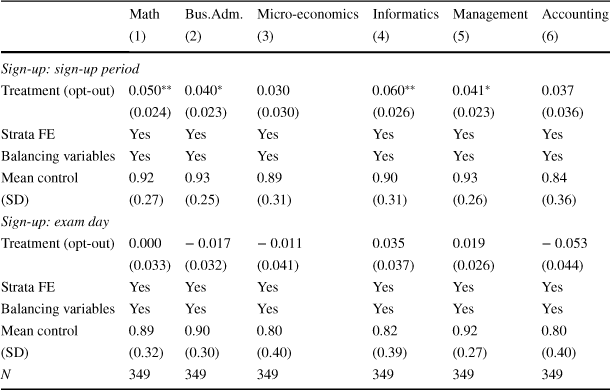
Figure 1 shows the mean number of exam sign-ups in the opt-out and the opt-in group after the sign-up period. All sign-ups are set to zero by the university as soon as a student drops out, which avoids an upward bias in the standard default effect due to inactive students who can no longer de-register. Students in the control group are signed up on average for 5.41 exams. The mean number of exams signed up for is roughly 0.27 exams higher in the treatment group, at 5.69. Regression results in Table 1 confirm these raw descriptive comparisons: we find a statistically significant increase of sign-ups in the opt-out group after the sign-up period of roughly 0.27 exams. As shown in Table 2, the effects on sign-up are positive for all six exams, and statistically significant for four of the six exams.
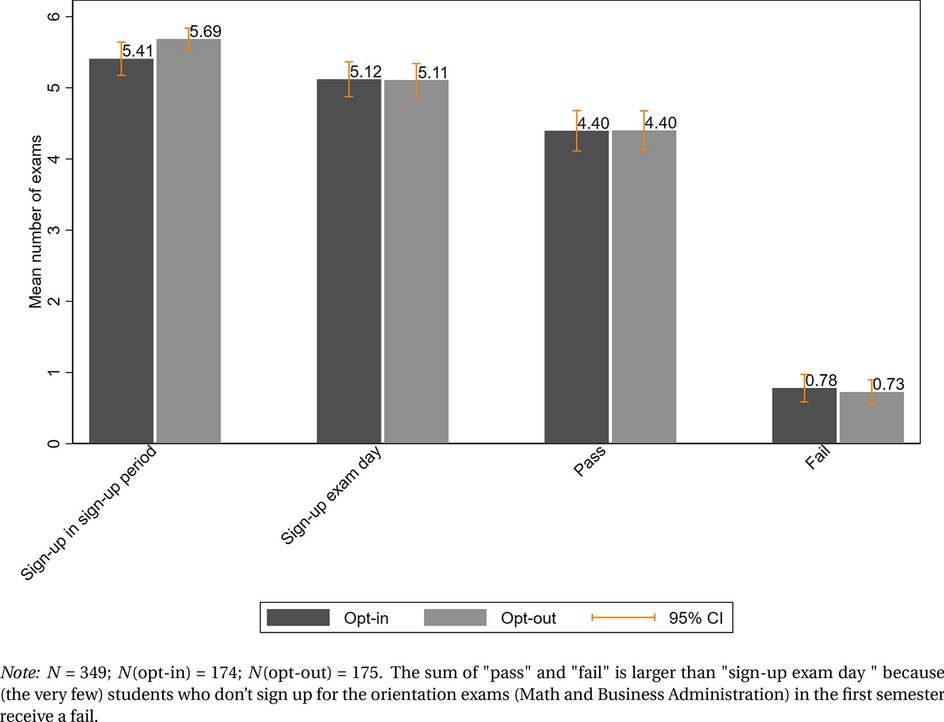
Fig. 1 Broad default—mean outcomes in the control versus treatment group
Table 1 Broad default—standard default effect
|
Sign-up |
||||
|---|---|---|---|---|
|
Sign-up period |
Exam day |
|||
|
(1) |
(2) |
(3) |
(4) |
|
|
Treatment (opt-out) |
|
|
− 0.018 |
− 0.027 |
|
(0.140) |
(0.137) |
(0.169) |
(0.160) |
|
|
Strata FE |
Yes |
Yes |
Yes |
Yes |
|
Balancing variables |
No |
Yes |
No |
Yes |
|
Mean control |
5.41 |
5.12 |
||
|
(SD) |
(1.58) |
(1.65) |
||
|
N |
349 |
349 |
||


OLS estimates. Dependent variables are the number of exams (recommended by the study curriculum) signed up for after the sign-up period and on exam day. Strata fixed effects (FE) based on high school GPA; balancing variables: high school GPA, age, age squared, age to the power of three, gender, enrollment day, application day, dummy for German citizenship, completed university semesters prior to current program
Robust standard errors in parentheses. *
 .1; **
 .05; ***
 .01
.01
Table 2 Broad default—standard default effect on individual exams
|
Math |
Bus.Adm. |
Micro-economics |
Informatics |
Management |
Accounting |
|
|---|---|---|---|---|---|---|
|
(1) |
(2) |
(3) |
(4) |
(5) |
(6) |
|
|
Sign-up: sign-up period |
||||||
|
Treatment (opt-out) |
|
|
0.030 |
|
|
0.037 |
|
(0.024) |
(0.023) |
(0.030) |
(0.026) |
(0.023) |
(0.036) |
|
|
Strata FE |
Yes |
Yes |
Yes |
Yes |
Yes |
Yes |
|
Balancing variables |
Yes |
Yes |
Yes |
Yes |
Yes |
Yes |
|
Mean control |
0.92 |
0.93 |
0.89 |
0.90 |
0.93 |
0.84 |
|
(SD) |
(0.27) |
(0.25) |
(0.31) |
(0.31) |
(0.26) |
(0.36) |
|
Sign-up: exam day |
||||||
|
Treatment (opt-out) |
0.000 |
− 0.017 |
− 0.011 |
0.035 |
0.019 |
− 0.053 |
|
(0.033) |
(0.032) |
(0.041) |
(0.037) |
(0.026) |
(0.044) |
|
|
Strata FE |
Yes |
Yes |
Yes |
Yes |
Yes |
Yes |
|
Balancing variables |
Yes |
Yes |
Yes |
Yes |
Yes |
Yes |
|
Mean control |
0.89 |
0.90 |
0.80 |
0.82 |
0.92 |
0.80 |
|
(SD) |
(0.32) |
(0.30) |
(0.40) |
(0.39) |
(0.27) |
(0.40) |
|
N |
349 |
349 |
349 |
349 |
349 |
349 |


OLS estimates. Dependent variables are the dummy variables for being signed up for the individual exams after the sign-up period and on exam day. Strata FE based on high school GPA; balancing variables: high school GPA, age, age squared, age to the power of three, gender, enrollment day, application day, dummy for German citizenship, completed university semesters prior to current program
Robust standard errors in parentheses. *
 .1; **
 .05; ***
 .01
.01
It is important to stress again that sign-up effects may be interpreted as conceptually analogous to most default effects in the literature (which require no further actions to reach the desired outcome). We thus show that such standard default effects can be found with tasks where post-intervention effort is necessary downstream. The effect size of roughly 0.21 (Cohen’s d) is small compared to the literature on defaults (Jachimowicz et al., Reference Jachimowicz, Duncan, Weber and Johnson2019 report an average effect size of 0.68). This is, however, consistent with the finding that behavioral interventions exhibit smaller effect sizes in education settings (see, e.g., Kraft, Reference Kraft2020; DellaVigna & Linos, Reference DellaVigna and Linos2022). One reason specific to our setting could be exactly the prospect of having to exert extra effort later due to the automatic sign-up, making students more likely to deviate from the default setting than in situations where only little investment of time and effort is needed after the intervention.
The initial default effects do not last, however. As can be seen in Fig. 1, Tables 1 and 2, on the day of the exam, we do not observe statistically significant differences between treatment and control group sign-ups, neither overall nor for any of the six exams individually (Table 2). This implies that after the sign-up period, students in the treatment group actively de-register from exams.
By initially sticking to the default, students in the opt-out group retain their options and postpone the decision which exams to take until later in the semester. During the sign-up period, only two weeks into the first semester, students may not yet know how much ability and effort is required to pass the exams and it therefore makes sense to stay with the default number of sign-ups until further information about the choice environment may suggest a change. Over time, they gain knowledge about how many exams they will be able to prepare for. If students then believe to have better information in this respect than the university, they should change the number of sign-ups during the de-registration period and the initial default effects should vanish (see also the lab experiments in Altmann et al., Reference Altmann, Falk and Grunewald2022; defaults conflicting with private information should have no effect).
2.2.2 Downstream default effects
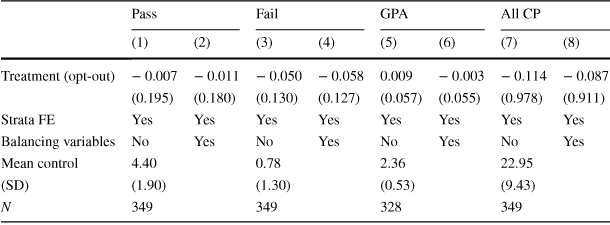
Not surprisingly then, the default intervention does not lead to effects on outcomes further downstream (see Fig. 1). The mean number of passed exams is 4.40 in both the control group and in the treatment group, the number of failed exams is 0.78 and 0.73, respectively. The corresponding regression results are shown in Table 3. There is also no evidence that the automatic sign-up has a negative effect on the overall GPA or on the overall number of credit points (Table 3).Footnote 19
Table 3 Broad default—downstream default effect
|
Pass |
Fail |
GPA |
All CP |
|||||
|---|---|---|---|---|---|---|---|---|
|
(1) |
(2) |
(3) |
(4) |
(5) |
(6) |
(7) |
(8) |
|
|
Treatment (opt-out) |
− 0.007 |
− 0.011 |
− 0.050 |
− 0.058 |
0.009 |
− 0.003 |
− 0.114 |
− 0.087 |
|
(0.195) |
(0.180) |
(0.130) |
(0.127) |
(0.057) |
(0.055) |
(0.978) |
(0.911) |
|
|
Strata FE |
Yes |
Yes |
Yes |
Yes |
Yes |
Yes |
Yes |
Yes |
|
Balancing variables |
No |
Yes |
No |
Yes |
No |
Yes |
No |
Yes |
|
Mean control |
4.40 |
0.78 |
2.36 |
22.95 |
||||
|
(SD) |
(1.90) |
(1.30) |
(0.53) |
(9.43) |
||||
|
N |
349 |
349 |
328 |
349 |
||||
OLS estimates. Dependent variables are the number of exams passed (net of transferred credits), failed exams, the overall GPA (only passing grades) and the number of all credits (all CP) net of transferred credits. N(GPA)
 328 because only passing grades are included. Strata FE based on high school GPA; balancing variables: high school GPA, age, age squared, age to the power of three, gender, enrollment day, application day, dummy for German citizenship, completed university semesters prior to current program. The sum of “pass” and “fail” is larger than “sign-up exam day” because (the very few) students who do not sign up for the orientation exams (Math and Business Administration) in the first semester receive a fail
Robust standard errors in parentheses. *
 .1; **
 .05; ***
 .01
.01
3 Field experiment II: targeted default
The second experiment is a conceptual replication (Nosek & Errington, Reference Nosek and Errington2017) of our first default study with a new cohort of BuA students, and a cohort of International Business (IB) students from the same university—an English-language program with tighter admission restrictions and fewer students. The goal is to test again whether an opt-out rule can generate standard default effects and whether it can move outcomes further downstream. However, this time we investigate a targeted default. Compared to the broad default, we implement the following changes: the intervention now takes place in the second semester instead of the first semester; also, instead of signing up students for all six exams that the study curriculum recommends for the second semester, we register students for only one of these, the statistics exam, which is a principles class that many students view as challenging and which is recommended to be taken in both programs in the second semester.
We hypothesized that the automatic sign-up in statistics should be more effective in changing downstream behavior than the broad default. The reason is that while students may feel they have better information than the default-setter on how many exams they are able to take (in the broad default), this may not be the case for the choice of which specific exams to take. This is a question that is particularly relevant (i) for students who decide to take fewer than all of the scheduled six exams in the first or second semester, and who therefore have to choose specific exams rather than go with the full schedule; (ii) for those second semester students who did not pass or take all exams of the first semester (this applies to more than half the cohort)—these students need to (re-)take some of the first semester exams and also have to decide which of the scheduled second semester exams they should take. However, the university does not provide any guidance or recommendations on which exams to prioritize, or how to combine the 30 credits recommended by the curriculum for the second semester with exams from the first semester that have been postponed or need to be retaken. A targeted default should be informative in that respect, as it stresses the importance of one specific task—the statistics course—and it may thus be able to elicit behavioral change.
3.1 Research design
The sample in this experiment consists of students who study towards a bachelor’s degree in BuA and IB in the second semester (as the statistics course is scheduled for the second semester). Randomization was carried out by stratifying on study program, the credit points obtained in the first semester, and whether a student applied for the program after the median application date, and by balancing on the covariates displayed in Table A.4 in the Appendix.Footnote 20
 Footnote 21 The table shows that all variables are balanced between the control and the treatment group.
Students in the treatment group were automatically signed up for the statistics exam. As in the broad default experiment, students in the opt-out group could de-register from the statistics exam, and students in the control group (opt-in) had to actively sign up if they wanted to take statistics.
3.1.1 Procedure
Prior to the start of the second semester, students were informed (via postal mail and e-mail; letters are displayed in the Online Material) about the registration procedure for the statistics exam that applies to them. During the sign-up period, students in the control group were able to register for all exams online. Students in the treatment group were already automatically signed up for the statistics exam and had the opportunity de-register from statistics and to register for additional exams. During the de-registration period, about three weeks later, students in both groups could de-register from exams. After this point, de-registration and deferring the exam is still possible if a doctor’s note is provided, otherwise statistics will be graded as failed. A timeline of the 2nd experiment is displayed in Fig. A.3 in the Appendix.
3.1.2 Outcomes
In order to test for standard default effects, we use the sign-ups for the statistics exam at two different points in time, after the initial sign-up period and on the day of the exam. The latter differs from initial sign-ups because some individuals de-register during the de-registration period, and some submit a doctor’s note that they were sick on the day of the exam, which results in a de-registration as well.
We again also evaluate downstream outcomes which go beyond standard default effects because they require students to invest time and effort: participation in the statistics exam, as well as passing and failing. Unlike in the first experiment, for statistics we also have data on actual exam participations.Footnote 22 This allows us to differentiate between exam failures due to no-shows (as not taking part in a registered exam counts as a fail; the only exception is that when a doctor’s note is submitted, not participating does not count as a fail) and failing grades due to actually failing the exam after taking part.Footnote 23
Since statistics is not the only exam scheduled in the 2nd semester, we also monitor possible spillover effects. Students may prioritize the statistics exam because of the treatment, but at the same time sign up for and pass fewer other exams. Similarly, the overall GPA may be affected by the default if treated students take more classes overall and therefore can allocate less study time to each. In order to make sure we do not miss such side effects, we preregistered to also analyze effects on the total number of exams signed up for, all passed exams, overall achieved credit points in the second semester, statistics grade, the overall GPA, and dropouts.
3.2 Pooled sample results: BuA and IB
We graphically report raw treatment effects and also provide OLS estimates from the following specification:

where the outcomes
 are binary variables indicating whether students sign up for, participate in, pass or fail statistics. As preregistered, we use one specification with strata dummies, as well as one that adds a vector of the balancing variables from the randomization. To analyze spillover effects we use the same covariates and
 now represents the total overall outcomes described in Sect. 3.1.2.
3.2.1 Standard default effects
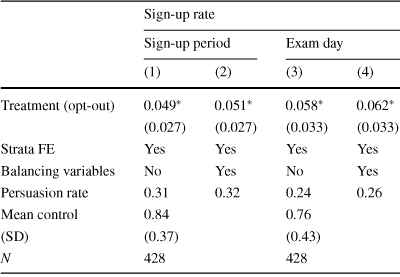
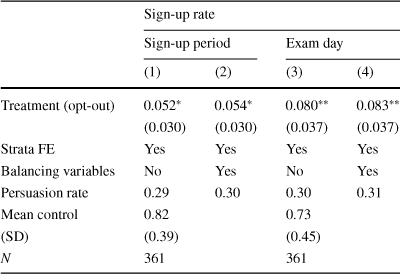
Analogous to the broad default, Fig. 2 shows the rates at which second semester students signed up for the statistics exam in the opt-out and the opt-in group. During the sign-up period, 83.6% of the students in the control group sign up for the exam, and being registered by default increases this number by about 4.3 pp. Columns (1) and (2) of Table 4 show the corresponding regression coefficients: being part of the opt-out group increases sign-ups by about 4.9 to 5.1 pp (Cohen’s h
 0.12). The replication experiment thus confirms our findings from the first experiment, where we also observe this standard default effect.
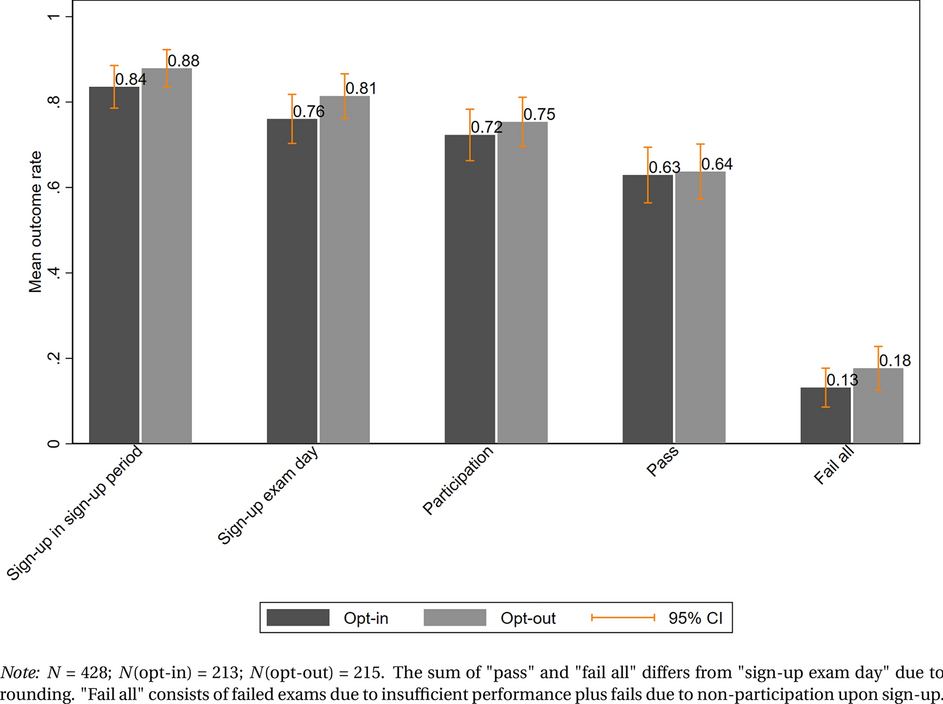
Fig. 2 Targeted default—mean outcomes control and treatment—pooled sample
Table 4 Targeted default—standard default effect—pooled sample
|
Sign-up rate |
||||
|---|---|---|---|---|
|
Sign-up period |
Exam day |
|||
|
(1) |
(2) |
(3) |
(4) |
|
|
Treatment (opt-out) |
|
|
|
|
|
(0.027) |
(0.027) |
(0.033) |
(0.033) |
|
|
Strata FE |
Yes |
Yes |
Yes |
Yes |
|
Balancing variables |
No |
Yes |
No |
Yes |
|
Persuasion rate |
0.31 |
0.32 |
0.24 |
0.26 |
|
Mean control |
0.84 |
0.76 |
||
|
(SD) |
(0.37) |
(0.43) |
||
|
N |
428 |
428 |
||


OLS estimates. Dependent variables are the indicators for sign-up in statistics after the sign-up period and on exam day. Strata FE: 1st semester CP FE
 a dummy for early/late application; balancing variables: high school GPA, age, gender, application day. The persuasion rate is calculated as
 where
where
 and
and
 are the outcomes in the treatment (T) and control (C) group
Robust standard errors in parentheses. *
 .1; **
 .05; ***
 .01
.01
Table 5 Targeted default—downstream default effect—pooled sample
|
Participation
|
Pass |
Fail all |
Fail no show |
Statistics grade |
||||||
|---|---|---|---|---|---|---|---|---|---|---|
|
(1) |
(2) |
(3) |
(4) |
(5) |
(6) |
(7) |
(8) |
(9) |
(10) |
|
|
Treatment (opt-out) |
0.037 |
0.040 |
0.014 |
0.017 |
0.044 |
0.045 |
0.021 |
0.022 |
0.202 |
0.194 |
|
(0.035) |
(0.035) |
(0.038) |
(0.038) |
(0.033) |
(0.033) |
(0.020) |
(0.021) |
(0.126) |
(0.124) |
|
|
Strata FE |
Yes |
Yes |
Yes |
Yes |
Yes |
Yes |
Yes |
Yes |
Yes |
Yes |
|
Balancing variables |
No |
Yes |
No |
Yes |
No |
Yes |
No |
Yes |
No |
Yes |
|
Persuasion rate |
0.13 |
0.14 |
– |
– |
– |
– |
– |
– |
– |
– |
|
Mean control |
0.72 |
0.63 |
0.13 |
0.04 |
2.70 |
|||||
|
(SD) |
(0.45) |
(0.48) |
(0.34) |
(0.19) |
(1.35) |
|||||
|
N |
428 |
428 |
428 |
428 |
337 |
|||||

OLS estimates. The dependent variables are indicators for participation in, passing of, failing of the statistics exam and failing because of not showing up to the the statistics exam and the statistics grade (includes fails). Strata FE: 1st semester CP FE
 a dummy for early/late application; balancing variables: high school GPA, age, gender, application day. The persuasion rate is calculated as
 where
where
 and
and
 are the outcomes in the treatment (T) and control (C) group. There is no persuasion rate for pass as students can only be “persuaded” to sign up and participate.
 The exam is graded as failed if students are signed up but do not show up, i.e. participation rate = pass rate + fail rate − fail rate no show. Robust standard errors in parentheses. *
 .1; **
 .05; ***
 .01
.01
In contrast to the broad default, the effect of the targeted default persists beyond the sign-up period. On the day of the exam the mean sign-up rate is still 5.3 pp higher in the opt-out group (Fig. 2), and regression results in Columns (3) and (4) of Table 4 show an increase of roughly 6 pp (Cohen’s h
 0.13). In Table 6 we also report persuasion rates. The persuasion rate relates the changes in sign-ups and participation to the base rates of these variables in the control group (see DellaVigna & Kaplan, Reference DellaVigna and Kaplan2007; DellaVigna & Gentzkow Reference DellaVigna and Gentzkow2010).Footnote 24 Our results indicate that about 31% of the students who would not have signed up in the sign-up period under the opt-in regulation were persuaded to do so by the opt-out regulation. For sign-ups on the exam day, the persuasion rate is about 25%.
In sum, in the targeted experiment we again find standard default effects. Effect sizes are typical for successful education interventions but much smaller than what is often reported for default interventions. Compared to the broad default, which only affected sign-ups in the sign-up period, the targeted default leads to sustained increases in sign-up for the opt-out group until the day of the exam.
3.2.2 Downstream default effects
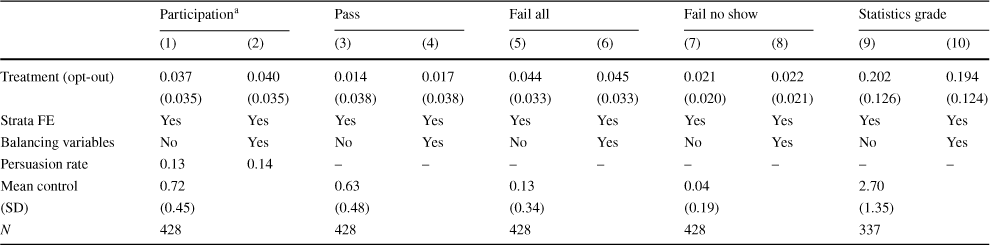
Regarding the outcomes further downstream which require effort, Fig. 2 displays that the participation rate in the statistics exam is 72% in the control group and 75% in the treatment group. Regressions in Table 5 show that this effect is roughly 4 pp but imprecisely measured (Columns 1 and 2). The point estimate for the treatment effect on the passing rate is almost the same between treatment and control group (roughly 64% in the treatment vs. 63% in the control group, not statistically significant; Columns 3 and 4). Overall, fails are 4.4 pp higher than in the control group (Columns 5 and 6, also not statistically significant), consisting of failed exams due to non-participation (2.1 pp, Columns 7 and 8) and failed exams upon participation.Footnote 25 We find no effect on grades in the statistics exam (Columns 9 and 10).
Table A.6 in the Appendix shows the secondary outcomes we preregistered in order to check for potentially negative spillovers. Overall, we find no spillover effects. The total number of exams (net of statistics) signed up for is not affected by the opt-out treatment (Columns 1 and 2). The effects on the total number of other exams passed and overall credits (both without statistics) are insignificant, yet the positive coefficients, if anything, tentatively indicate positive spillover effects (Columns 3 and 4). The overall GPA and the number of students who dropped out of the study program after the treatment are also not affected.Footnote 26 All outcomes are, however, imprecisely measured, and it has to be taken into account that the intervention was not powered to find small effects (see footnote 21).
Overall, the targeted default leads to a standard default effect that goes beyond the initial sign-up period, as sign-ups on exam day are also positively affected. Downstream, we see a positive point estimate for participating in the statistics exam, but it is imprecisely measured. As hypothesized at the beginning of this section, the reason for the longer-lasting effects may be that the information conveyed by the targeted default is more relevant than in the case of the broad default. This is because many second-semester students (especially those who have to (re-)take exams from the first semester) may not know which specific exams to choose and the university does not provide guidance on this matter. In contrast, during the first semester, students can simply follow the predetermined study plan.
Next, we will analyze the BuA and IB study programs separately, as there are considerable differences in student characteristics and institutional settings between BuA and IB, which likely lead to differences in the effectivenes of the default.
3.3 Heterogeneity I—BuA versus IB students
Above we have reported the preregistered results for the pooled sample (BuA and IB). Although both programs cover similar material, the student bodies and the institutional settings are quite different. As a result, the amount of private information available to the students about their studies, and the alignment of interests between students and the university may differ between BuA and IB, leading to heterogeneous behavioral responses. We therefore discuss the differences between BuA and IB in terms of these aspects, and report the treatment effects separately for both programs (in Sect. 3.3.2 we focus on BuA students, Sect. 3.3.3 reports the effects in the IB sample).Footnote 27 A further reason for examining the results within programs is that this facilitates a direct comparison between the broad and targeted default, since the broad default experiment was only conducted in BuA.Footnote 28
3.3.1 Information and alignment of interests: differences between BuA and IB
Information An important determinant of the effectiveness of defaults is the private information the decision maker has (McKenzie et al., Reference McKenzie, Liersch and Finkelstein2006; Altmann et al., Reference Altmann, Falk and Grunewald2022). If students believe they have better information than the university about which exams to take when, they will not pay much attention to the implicit endorsement provided by the default to take statistics, thus weakening its effect.Footnote 29
BuA is the largest degree program in the department, and its students make up for the majority of the sample (84%, N
 361). IB, in contrast, is a rather small program with tighter admission restrictions and only 67 students. The small size of the IB program is likely to facilitate the exchange of information through closer networks with peers and faculty. For BuA, on the other hand, the more anonymous environment may make it more difficult to get in touch with peers, contact faculty and obtain information about how to organize the second semester. We collected data and asked second semester IB and BuA students who were not part of our experiment about their study network. IB students report an average of about 3.4 contacts, while BuA students report only 2.32 contacts (t-test on mean differences,
 ,
,
 ).Footnote 30
IB students also had much better grades in school, with an average high school GPA of 1.86 compared to 2.48 for BuA students (t-test on mean differences,
 ). This ability differential is reflected in the fact that IB students pass more exams in the first semester (5.66 vs. 5.04 for BuA,
 ). The curricula stipulate six exams in the first semester for both programs, so BuA students in the treatment semester on average have to (re-)take almost an entire exam from the first semester. They thus have to make a decision on how to combine obtaining the 30 credits recommended by the curriculum for the second semester with the remaining first semester exam. For example, they need to assess whether they should postpone one second semester exam in order not to increase their workload by too much, and if so which exam they should postpone (e.g., statistics). Since the curricula do not provide guidance on how to combine first and second semester exams or which exams to prioritize, the targeted default should be informative in this regard, and—given their first semester passing rates—the value of information contained in the default is likely to be higher for BuA than for IB students.
Taken together, the differences in program size and student characteristics suggest that BuA students may pay more attention to the default than IB students and consider it more individually relevant, making the implicit endorsement to take statistics stronger in BuA than in IB.
Alignment of interests A second prerequisite for the acceptance of defaults and the effectiveness of the endorsement mechanism is the alignment of interests between choice architect and decision maker (see Tannenbaumet al., Reference Tannenbaum, Fox and Rogers2017; Altmann et al., Reference Altmann, Falk and Grunewald2022; Ortmann et al., Reference Ortmann, Ryvkin, Wilkening and Zhang2023).Footnote 31 Thus, one would expect that students will only stick with the default, consider the signal of the default to take statistics in the 2nd semester as individually relevant, and incorporate it into their beliefs if their interests are aligned with those of the default setter (i.e. if the interests are aligned with the implicit advice contained in the default).
Given that IB students are academically stronger than BuA students, it is not surprising that 94% of the IB controls (BuA: 82%) register for statistics during the sign-up period (see Fig. A.4). For the remaining few IB students who do not sign up, it is likely that their interests are not aligned with the implicit advice conveyed by the default. The default conveys the university’s interest that students take the statistics exam in the second semester, as recommended in both the BuA and the IB curricula. According to the BuA curriculum, however, students have to take all first and second semester exams of the study plan, including statistics, at least once by the third semester. In the IB curriculum, no such rule exists. Specifically, this means that statistics can be taken later on, or during the mandatory semester abroad at a foreign university, where it may be less challenging. Therefore, BuA students who would not sign up for the exam in the absence of the default may be more likely than their IB counterparts to believe that the default is individually appropriate for them. We would thus expect the default to be less effective for IB.
In addition to the just discussed differences in information and alignment of interests, there is also little room for increases in sign-ups in IB due to the already very high baseline sign-up rate.
3.3.2 Results for BuA students
All covariates in the BuA sample are balanced (see Table A.4). We report results using the same OLS specification as in Eq. (2).Footnote 32
Standard default effect
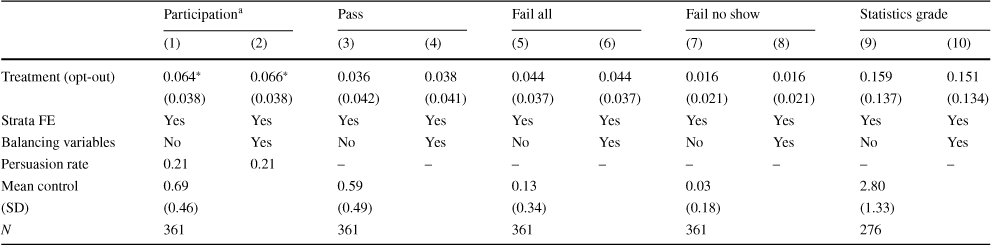
Figure 3 shows that about 82% of BuA control group students sign up for the exam. This number drops to 73% on the day of the exam and only 69% participate in the exam.
Among BuA students the default treatment increases the mean sign-up rate after the initial period by about 4 pp to 86%. On the day of the exam it is even 7 pp higher in the treatment group (80%). Regression results displayed in Table 6 confirm these findings, as the signups after the initial period are increased by 5.2–5.4 pp (columns 1 and 2; Cohen’s h
 0.15), and on exam day by 8–8.3 pp (columns 3 and 4; Cohen’s h
 0.19). The persuasion rate after the initial period is similar to the pooled sample at about 30%. On the day of the exam, it is still at 30% (higher than the 14% we observe in the pooled sample).
Downstream default effect
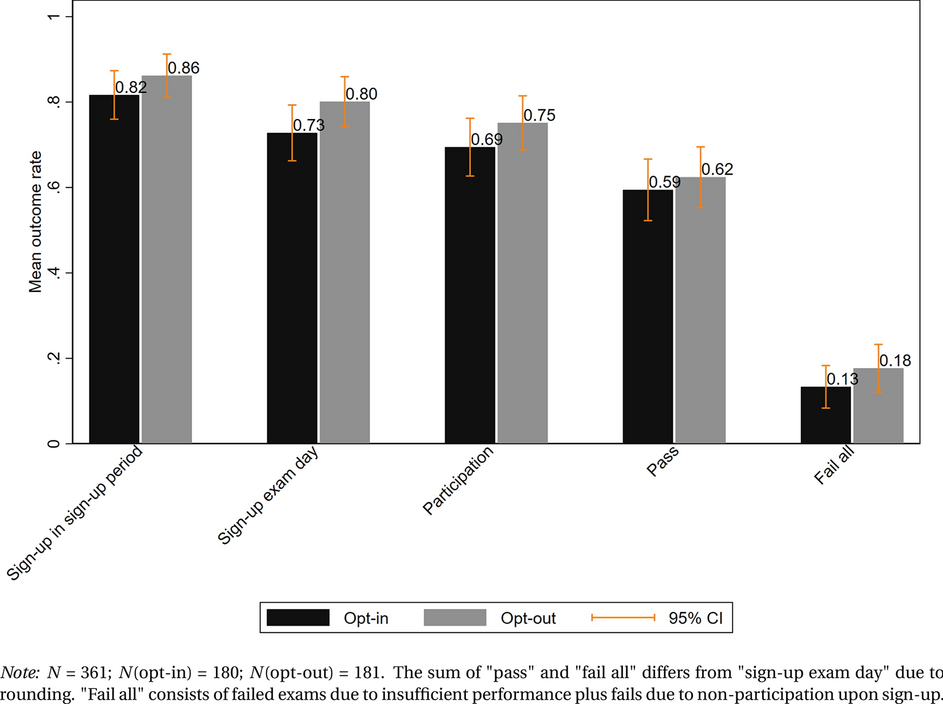
Fig. 3 Targeted default—mean outcomes control and treatment
Table 6 Targeted default—standard default effect
|
Sign-up rate |
||||
|---|---|---|---|---|
|
Sign-up period |
Exam day |
|||
|
(1) |
(2) |
(3) |
(4) |
|
|
Treatment (opt-out) |
|
|
|
|
|
(0.030) |
(0.030) |
(0.037) |
(0.037) |
|
|
Strata FE |
Yes |
Yes |
Yes |
Yes |
|
Balancing variables |
No |
Yes |
No |
Yes |
|
Persuasion rate |
0.29 |
0.30 |
0.30 |
0.31 |
|
Mean control |
0.82 |
0.73 |
||
|
(SD) |
(0.39) |
(0.45) |
||
|
N |
361 |
361 |
||


OLS estimates. Dependent variables are the indicators for sign-up in statistics after the sign-up period and on exam day. Strata FE: 1st semester CP FE
 a dummy for early/late application; balancing variables: high school GPA, age, gender, application day. The persuasion rate is calculated as
 where
where
 and
and
 are the outcomes in the treatment (T) and control (C) group
Robust standard errors in parentheses. *
 .1; **
 .05; ***
 .01
.01
We see large differences between the pooled sample and BuA students for outcomes downstream. Figure 3 shows that the mean participation rate among BuA control group students is 69%. The mean participation rate in the treatment group is 6 pp higher (75%). Columns (1) and (2) of Table 7 show that being signed up by default elicits a statistically significant effect of roughly 6.5 pp on exam participation, corresponding to a persuasion rate of 21%. The point estimate for the treatment effect on passing is almost 4 pp (roughly 63% in the treatment vs. 59% in the control group, not statistically significant). We do not find statistically significant effects on overall fails or fails due to no show and on the statistics grade (columns 5–10 of Table 7).
Table 7 Targeted default—downstream default effect
|
Participation
|
Pass |
Fail all |
Fail no show |
Statistics grade |
||||||
|---|---|---|---|---|---|---|---|---|---|---|
|
(1) |
(2) |
(3) |
(4) |
(5) |
(6) |
(7) |
(8) |
(9) |
(10) |
|
|
Treatment (opt-out) |
|
|
0.036 |
0.038 |
0.044 |
0.044 |
0.016 |
0.016 |
0.159 |
0.151 |
|
(0.038) |
(0.038) |
(0.042) |
(0.041) |
(0.037) |
(0.037) |
(0.021) |
(0.021) |
(0.137) |
(0.134) |
|
|
Strata FE |
Yes |
Yes |
Yes |
Yes |
Yes |
Yes |
Yes |
Yes |
Yes |
Yes |
|
Balancing variables |
No |
Yes |
No |
Yes |
No |
Yes |
No |
Yes |
No |
Yes |
|
Persuasion rate |
0.21 |
0.21 |
– |
– |
– |
– |
– |
– |
– |
– |
|
Mean control |
0.69 |
0.59 |
0.13 |
0.03 |
2.80 |
|||||
|
(SD) |
(0.46) |
(0.49) |
(0.34) |
(0.18) |
(1.33) |
|||||
|
N |
361 |
361 |
361 |
361 |
276 |
|||||


OLS estimates. The dependent variables are indicators for participation in, passing of, failing of the statistics exam, failing because of not showing up to the the statistics exam, and the statistics grade (includes fails). Strata FE: 1st semester CP FE
 a dummy for early/late application; balancing variables: high school GPA, age, gender, application day. The persuasion rate is calculated as
 where
where
 and
and
 are the outcomes in the treatment (T) and control (C) group. There is no persuasion rate for pass as students can only be “persuaded” to sign up and participate.
 The exam is graded as failed if students are signed up but do not show up, i.e. participation rate = pass rate + fail rate − fail rate no show
Robust standard errors in parentheses. *
 .1; **
 .05; ***
 .01
.01
Table A.7 shows that the effects can be viewed as net positives, as we again do not observe any negative spillover effects on total credits signed-up for, passed, or on the GPA; however these outcomes are imprecisely measured, and the intervention is not powered to reliably detect potential small effects (see footnote 31 for the power analysis for the BuA sample).
Overall, we find similar results to the pooled sample but slightly larger in size. In addition, we now find a significant downstream effect on participation, and a positive point estimate for passing.
3.3.3 Results for IB students
We find no statistically significant standard default effects for the IB students (see Table A.9 in the Appendix). For the initial sign-up period the estimate is 3 pp, for the day of the exam it is
 to
to
 pp, both imprecisely estimated. Downstream we find no statistically significant effects either (see Table A.10 in the Appendix). The treatment parameter for participation is negative, and accordingly the parameter for passing, since students who did not participate cannot pass the exam. We find that this can almost entirely be explained by an 8 to 9 pp increase of students in the treatment group who obtained a sick note from a doctor for the day of the exam (Columns 11 and 12).Footnote 33 With such a small sample size as in the IB program this may be due to statistical chance (three students with a doctor’s note account for the effect), but it is also possible that some students obtain doctor’s notes strategically to opt out of the exam, and that the propensity to do so is affected by treatment. There are no statistically significant effects on any secondary outcomes (Table A.11 in the Appendix).
3.4 Heterogeneity II: responsive individuals
So far, we have shown that BuA students are driving the effectiveness of the default intervention. We also argued in Sect. 3.3.1 that this is likely due to differences in student characteristics and the institutional setting of the programs. Therefore, for the remainder of the paper, we will focus on the BuA program.
The recent literature shows that default effects can be rather heterogeneous (see, e.g., Jachimowicz et al., Reference Jachimowicz, Duncan, Weber and Johnson2019 and Mertens et al., Reference Mertens, Herberz, Hahnel and Brosch2022), more generally: Bryan et al., Reference Bryan, Tipton and Yeager2021), and, as discussed in Sect. 3.3.1, Tannenbaum et al. (Reference Tannenbaum, Fox and Rogers2017) as well as more recently Altmann et al. (Reference Altmann, Falk and Grunewald2022) point out that alignment of interests between the default-setter and the defaulted individual drives default effectiveness. In addition, Heffetz et al. (Reference Heffetz, O’Donoghue and Schneider2022) suggests that nudges are more effective for individuals who have shown responsive behavior in the past.
Therefore, in an explorative analysis within the BuA sample, we evaluate the effectiveness of the opt-out rule for responsive students, defined as those who responded to unrelated requests from the university to take part in a survey collecting feedback on students’ study experience (40% of students responded). Responsive students participated in a voluntary online-survey, the “Student Satisfaction Monitor” (see Heffetz et al., Reference Heffetz, O’Donoghue and Schneider2022 for a similar approach to responsiveness in a setting with a reminder nudge). The survey is not conditional on signing up for statistics, it is regularly conducted among all students of the department and asks a series of general questions regarding the study program, life/study satisfaction, stress etc., and in this iteration of the survey we added some questions about the statistics lectures, which will help us explore the channels behind the treatment effects (see Sect. 3.6).
The dean of the faculty of Business Administration invited students via e-mail to take part in this survey. The decision to participate in the survey is thus independent of the default intervention, as neither the invitation letter, the name of the survey, nor the person sending the invitation have any connection to the intervention. Students who did not respond to the initial request to participate in the survey and to two further reminder e-mails are classified as “non-responsive”.
Responding to the survey request shows that these students are open and responsive to communication from the university, and are motivated to provide feedback. Responsive individuals are likely to pay attention to the default at a higher ratee, may incorporate the information provided by the default into their beliefs, and, therefore, show a higher propensity to act in accordance with implicit endorsements or recommendations of the default (Madrian & Shea, Reference Madrian and Shea2001; McKenzie et al., Reference McKenzie, Liersch and Finkelstein2006; Beshears et al., Reference Beshears, Choi, Laibson and Madrian2009; Carroll et al., Reference Carroll, Choi, Laibson, Madrian and Metrick2009; Dinner et al., Reference Dinner, Johnson, Goldstein and Liu2011; Sunstein, Reference Sunstein2013; Jachimowicz et al., Reference Jachimowicz, Duncan, Weber and Johnson2019).
In addition, we argue that the university and the responsives have more aligned interest than the full BuA sample when it comes to (quick) completion of the program. As one of the main objectives of a university is to graduate its students (on time), the interests of the responsive students are likely to be more aligned with the goals of the university than is the case for the non-responsive students.Footnote 34 The alignment of interests should further contribute to the exam opt-out rule being more effective for responsives.
The survey took place post-treatment, but we will in the following show evidence that participation is independent of treatment. Overall, 145 students (40% of the BuA sample) participated in the survey. Table A.12 in the Appendix shows that responding to the survey is not significantly affected by treatment. This is the first condition to allow a credible estimation of treatment effects in this sample. The second condition is that among the responsives, those in the treatment and control group do not differ in their characteristics. We find that all covariates are balanced between treatment and control in the subsample of responsive students (Table A.13 in the Appendix).
Note that responsiveness is not the same as high ability. While a comparison of the high school GPA between responsive and non-responsive students (2.41 vs. 2.51; p-value: 0.02) shows that the responsives are a positively selected sample in terms of their ability, there are also lower achieving students who have aligned interests and are responsive. As we will show in Sect. 3.5, the lowest achieving students (in terms of pre-treatment credits) among the responsive students actually benefit most from the default intervention (this is not the case for the non-responsives, which also underscores that responsiveness and ability are distinct concepts). In the following, we report results using the same OLS specification as in Eq. (2). We estimate the parameters for the sample of responsives and the sample of non-responsives.Footnote 35
3.4.1 Standard default effects
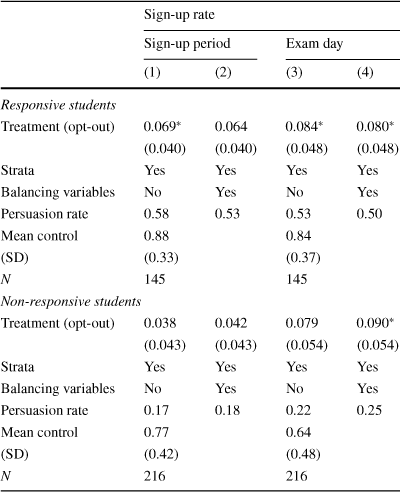
Figure 4 shows that among responsives, the mean sign-up rate in the control group after the sign-up period is 88%, and on the day of the exam 84% are still registered for the exam. Despite these high base levels, the opt-out treatment is able to increase sign-up by 8 pp, and on the day of the exam the mean sign-up rate for treated responsives is 9 pp higher than in the control group. The regression results in Table 8 (upper panel) confirm this: responsive students who were automatically signed up for the exam have a 6.4 to 6.9 pp higher sign-up rate after the sign-up period. On the day of the exam it is 8 to 8.4 pp higher (Cohen’s h
 0.26).
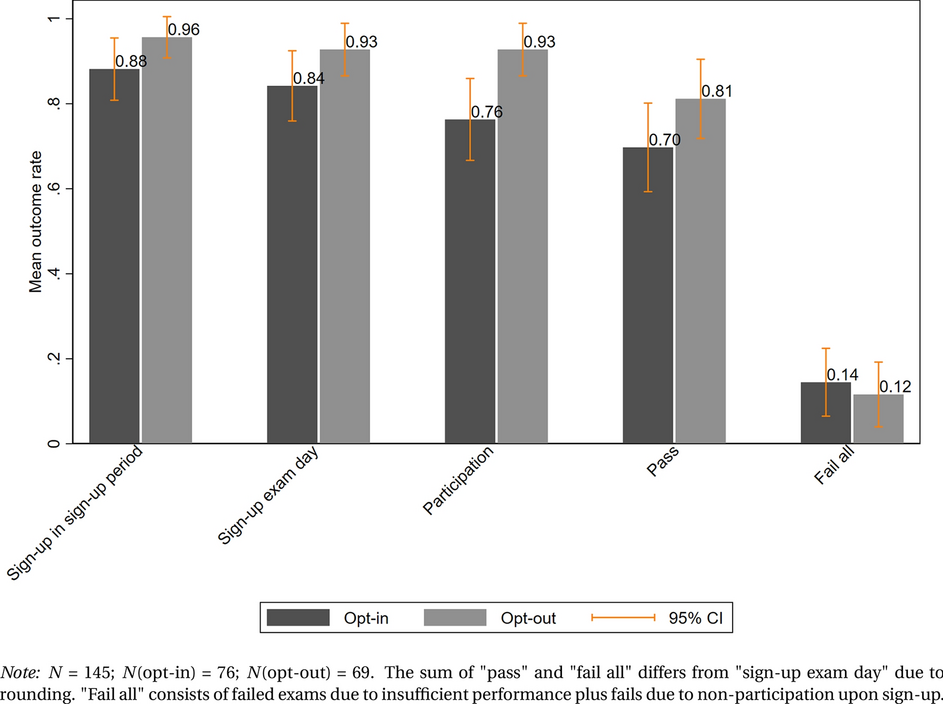
Fig. 4 Targeted default (responsive students)—mean outcomes in control and treatment
Table 8 Targeted default—standard default effect, (non)responsives
|
Sign-up rate |
||||
|---|---|---|---|---|
|
Sign-up period |
Exam day |
|||
|
(1) |
(2) |
(3) |
(4) |
|
|
Responsive students |
||||
|
Treatment (opt-out) |
|
0.064 |
|
|
|
(0.040) |
(0.040) |
(0.048) |
(0.048) |
|
|
Strata |
Yes |
Yes |
Yes |
Yes |
|
Balancing variables |
No |
Yes |
No |
Yes |
|
Persuasion rate |
0.58 |
0.53 |
0.53 |
0.50 |
|
Mean control |
0.88 |
0.84 |
||
|
(SD) |
(0.33) |
(0.37) |
||
|
N |
145 |
145 |
||
|
Non-responsive students |
||||
|
Treatment (opt-out) |
0.038 |
0.042 |
0.079 |
|
|
(0.043) |
(0.043) |
(0.054) |
(0.054) |
|
|
Strata |
Yes |
Yes |
Yes |
Yes |
|
Balancing variables |
No |
Yes |
No |
Yes |
|
Persuasion rate |
0.17 |
0.18 |
0.22 |
0.25 |
|
Mean control |
0.77 |
0.64 |
||
|
(SD) |
(0.42) |
(0.48) |
||
|
N |
216 |
216 |
||


OLS estimates. Dependent variables are the indicators for sign-up in statistics after the sign-up period and on exam day. Strata FE: 1st semester CP FE
 a dummy for early/late application; balancing variables: high school GPA, age, gender, application day. The persuasion rate is calculated as
 where
where
 and
and
 are the outcomes in the treatment (T) and control (C) group
Robust standard errors in parentheses. *
 .1; **
 .05; ***
 .01
.01
While the size of the point estimates is similar for the non-responsive students (Table 8, lower panel), this does not mean that the default is equally effective at changing their behavior. The persuasion rates for the responsives are 53–58% after the sign-up period and 50–53% on the day of the exam. Half the students in the treatment group who would not have signed up under the opt-in regime are persuaded to do so by the opt-out rule. Among the non-responsive students we find much lower persuasion rates of about 18% after the sign-up period and 22–25% on the day of the exam—indicating lower effectiveness of the default.
3.4.2 Downstream default effects
Figure 4 shows that the participation rate among treated responsives is 93%—the same as the sign-up rate on exam day. In the control group, this share declines from 84% to 76% and together this leads to a 16 pp treatment effect on exam participation (Columns 1 and 2 in Table 9). While roughly 8 pp of the non-responsive students who are signed up on exam day do not participate in the exam, all responsive students in the opt-out group who stayed signed up until exam day participated. Overall, among responsives, the opt-out treatment persuades 69% of those who otherwise would not have participated in statistics to attend the exam.
Table 9 Targeted default—downstream default effect, (non)responsives
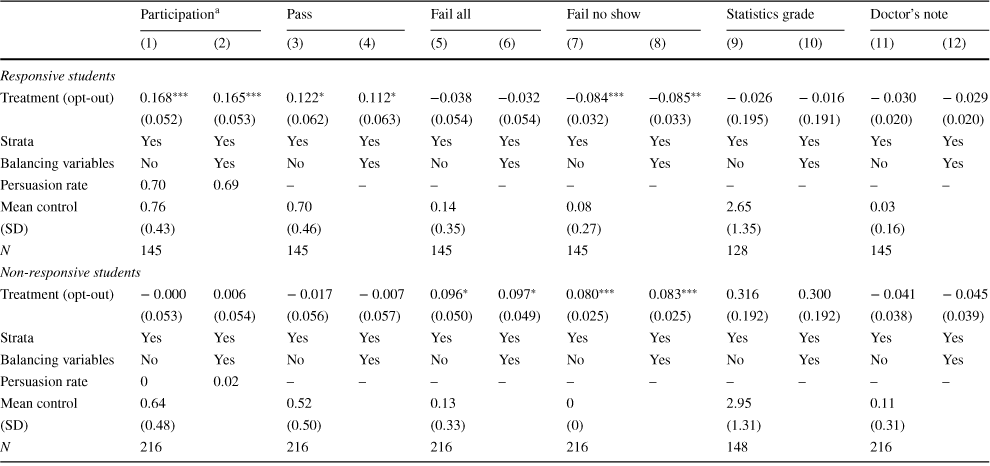
|
Participation
|
Pass |
Fail all |
Fail no show |
Statistics grade |
Doctor’s note |
|||||||
|---|---|---|---|---|---|---|---|---|---|---|---|---|
|
(1) |
(2) |
(3) |
(4) |
(5) |
(6) |
(7) |
(8) |
(9) |
(10) |
(11) |
(12) |
|
|
Responsive students |
||||||||||||
|
Treatment (opt-out) |
|
|
|
|
|
|
|
|
− 0.026 |
− 0.016 |
− 0.030 |
− 0.029 |
|
(0.052) |
(0.053) |
(0.062) |
(0.063) |
(0.054) |
(0.054) |
(0.032) |
(0.033) |
(0.195) |
(0.191) |
(0.020) |
(0.020) |
|
|
Strata |
Yes |
Yes |
Yes |
Yes |
Yes |
Yes |
Yes |
Yes |
Yes |
Yes |
Yes |
Yes |
|
Balancing variables |
No |
Yes |
No |
Yes |
No |
Yes |
No |
Yes |
No |
Yes |
No |
Yes |
|
Persuasion rate |
0.70 |
0.69 |
– |
– |
– |
– |
– |
– |
– |
– |
– |
– |
|
Mean control |
0.76 |
0.70 |
0.14 |
0.08 |
2.65 |
0.03 |
||||||
|
(SD) |
(0.43) |
(0.46) |
(0.35) |
(0.27) |
(1.35) |
(0.16) |
||||||
|
N |
145 |
145 |
145 |
145 |
128 |
145 |
||||||
|
Non-responsive students |
||||||||||||
|
Treatment (opt-out) |
− 0.000 |
0.006 |
− 0.017 |
− 0.007 |
|
|
|
|
0.316 |
0.300 |
− 0.041 |
− 0.045 |
|
(0.053) |
(0.054) |
(0.056) |
(0.057) |
(0.050) |
(0.049) |
(0.025) |
(0.025) |
(0.192) |
(0.192) |
(0.038) |
(0.039) |
|
|
Strata |
Yes |
Yes |
Yes |
Yes |
Yes |
Yes |
Yes |
Yes |
Yes |
Yes |
Yes |
Yes |
|
Balancing variables |
No |
Yes |
No |
Yes |
No |
Yes |
No |
Yes |
No |
Yes |
No |
Yes |
|
Persuasion rate |
0 |
0.02 |
– |
– |
– |
– |
– |
– |
– |
– |
– |
– |
|
Mean control |
0.64 |
0.52 |
0.13 |
0 |
2.95 |
0.11 |
||||||
|
(SD) |
(0.48) |
(0.50) |
(0.33) |
(0) |
(1.31) |
(0.31) |
||||||
|
N |
216 |
216 |
216 |
216 |
148 |
216 |
||||||


OLS estimates. The dependent variables are indicators for participation in, passing of, failing of the statistics exam and failing because of not showing up to the the statistics exam and the statistics grade (includes fails), and whether a student deregistered with a doctor’s note. Strata FE: 1st semester CP FE
 a dummy for early/late application; balancing variables: high school GPA, age, gender, application day. The persuasion rate is calculated as
 where
where
 and
and
 are the outcomes in the treatment (T) and control (C) group. There is no persuasion rate for pass as students can only be “persuaded” to sign up and participate.
 The exam is graded as failed if students are signed up but do not show up, i.e. participation rate
 pass rate + fail rate − fail rate no show.
Robust standard errors in parentheses. *
 .1; **
 .05; ***
 .01
.01
This result is of interest, because it implies that defaults can positively affect the outcomes downstream, even for individuals who would have signed up under an opt-in rule anyway, i.e. in the absence of an intervention.Footnote 36 This suggests that not all sign-ups are equally binding. It seems that the barrier to opting out of the exam (via non-participation) is higher when this overrides the selection made by the university. The opt-out rule might lead students to actually take the exam which they would not have done under the opt-in rule (though they would have signed up in both cases). Opt-out defaults may thus increase the bindingness of the same choice versus opt-in, and may lead people to make downstream investments in time and effort. Some evidence for the latter can be found in the fact that, as we shown in Sect. 3.6, responsive students are more likely to attend lectures and spend more time studying for statistics.
For responsives the treatment also increases successful task completion, i.e. the passing rate by 11 pp (see Fig. 4, 70% in the opt-in group versus 81% in the opt-out group). Regression results confirm this and show a statistically significant increase in the passing rate of 11.2 to 12.2 pp (no persuasion rate reported, as we do not consider outcomes beyond participation to be the result of persuasion). This highlights that for responsive individuals, defaults may greatly improve even outcomes which require considerable post-treatment investment of time and effort.Footnote 37
By contrast, for non-responsive students the participation rate in the control and the treatment group is equal, at 64%, and the passing rate is 52% in the control and 51% in the treatment group (Fig. 5). The regression results in Table 9 also show that there are no treatment effects on participation (the persuasion rate is effectively zero) or passing for non-responsives.
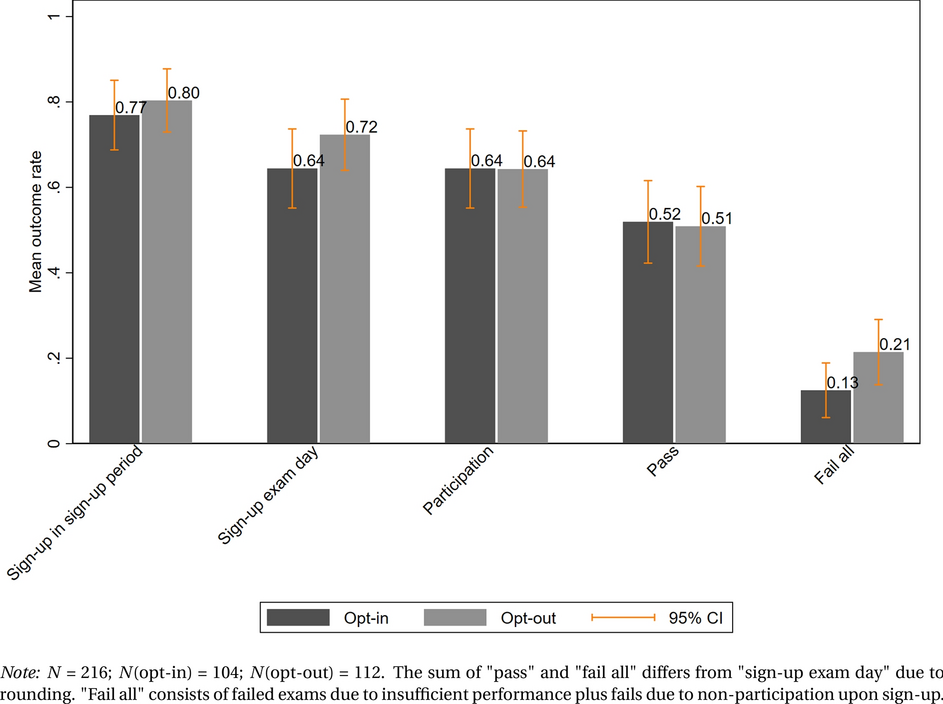
Fig. 5 Targeted default (non-responsive students)—mean outcomes control and treatment
Of note, we see differences in how the default affects exam fails. While there is no effect for responsive individuals, the fail rate among the non-responsives increases by almost 10 pp (Columns 5 and 6). In our data, we can differentiate between taking and failing an exam, and failures due to not showing up (“fail no-show”). The increase in fails can be explained almost entirely by students who did not show up for the exam (8.4–8.5 pp, Columns 7 and 8). The increase in no-shows among non-responsives is a possible consequence of the composition and characteristics of the group. In many European universities, where there are no tuition fees, there are students who are enrolled only to receive student benefits such as free public transport or health insurance. Or there may be students who decide during the semester that they will drop out, but they remain enrolled until they have figured out their alternative. In either case, we would expect to find these inactive individuals more often among the non-responsives than among the responsives (since responding to the survey shows engagement with the study program). Inactive treated students are likely to be indifferent or even unaware that they have been signed up for statistics, and do not show up for the exam: defining inactive students as not having acquired any credits in the treatment semester, we find that, in fact, of the 9 non-responsive no-shows, 8 are inactive. There should be as many inactive students in the control group as there are in treatment. They, however, likely do not sign up for the exam in the first place. There should thus be fewer no-shows in control than in the treatment group, which is what we see in the data.
Among the responsive students, on the other hand, we find a 8.4–8.5 pp lower rate of failed exams due to no-shows compared to control (Table 9, Columns 7 and 8). As we will show in Sect. 3.6, the default treatment increases participation in the statistics lecture and time spent studying for the course (see Table 10). This increased effort can plausibly decrease the probability of not showing up to the exam (because the students are better prepared), leading to the lower number of no-shows among responsive treated students compared to responsive controls.
Table 10 Targeted default—mechanism
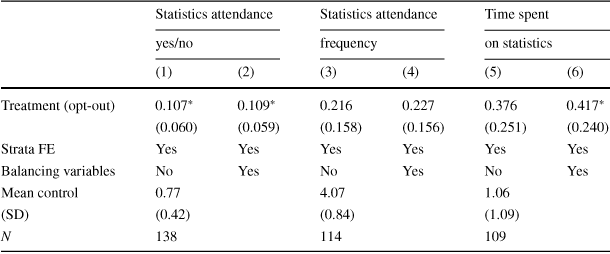
|
Statistics attendance |
Statistics attendance |
Time spent |
||||
|---|---|---|---|---|---|---|
|
yes/no |
frequency |
on statistics |
||||
|
(1) |
(2) |
(3) |
(4) |
(5) |
(6) |
|
|
Treatment (opt-out) |
|
|
0.216 |
0.227 |
0.376 |
|
|
(0.060) |
(0.059) |
(0.158) |
(0.156) |
(0.251) |
(0.240) |
|
|
Strata FE |
Yes |
Yes |
Yes |
Yes |
Yes |
Yes |
|
Balancing variables |
No |
Yes |
No |
Yes |
No |
Yes |
|
Mean control |
0.77 |
4.07 |
1.06 |
|||
|
(SD) |
(0.42) |
(0.84) |
(1.09) |
|||
|
N |
138 |
114 |
109 |
|||


OLS estimates. Strata FE: 1st semester CP FE
 dummy for early/late application; balancing variables: high school GPA, age, gender, application day. Robust standard errors in parentheses. *
 .1; **
 .05; ***
 .01. Question for statistics attendance (yes/no): Do you visit the lecture and/or tutorial in Statistics in the current semester? [1
 Yes, 0
 No]; question for statistics attendance (frequency): How often have you attended the Statistics lectures (including exercises and tutorials) in the current semester? [0—never, i.e. 0% of all classes, 1–1 to 25% of all classes, 2–26 to 50%, 3–51 to 75%, 4–76 to 99%, 5–100%”]; question for time spent on statistics: On average, how many hours per week did you spend studying Statistics this semester, lectures and tutorials not included? [0—up to 1 h per week; 1—over 1 up to 2 h per week; 2—over 2 up to 3 h per week; 3—over 3 up to 4 h per week; 4—over 4 up to 5 h per week; 5—more than 5 h per week]
Table A.16 in the Appendix shows the secondary outcomes for responsive and non-responsive students; we again check for negative spillovers. For responsive students, none of the overall outcomes is significantly changed by treatment. The point estimates indicate that initial overall sign-ups (net of statistics) slightly decrease for responsives, the overall number of passed exams increases, leading to an increase in overall credits (both net of statistics) of more than one credit point. If anything, this tentatively indicates a positive spillover effect for responsive students. Treated non-responsives sign up for and pass slightly more exams, however the difference is not statistically significant. In addition, the overall GPA of non-responsives is somewhat lower with treatment. In light of recent findings about negative spillovers for nudges where the target outcome requires attention and effort (Trachtman, Reference Trachtman2021), the fact that negative effects on secondary outcomes are mostly absent is reassuring. One caveat, however, is that the MDE for the subsample analysis does not allow to reliably detect small effects (footnote 33 ).
Overall, our results are in line with Altmann et al. (Reference Altmann, Falk and Grunewald2022) who show that while individuals benefit from defaults when interests are aligned with the default setter, under misaligned interests, individuals may stick to defaults too often. Ultimately this can lead to detrimental consequences. In our case, the interests of at least some of the non-responsives are probably not aligned with the interests of the default setter. Still, they stick with the default, which leads to fails due to no-shows.
3.5 Heterogeneity III: effects on high and low achieving individuals
An important question for interventions in general, and specifically education interventions is what their “distributional” implications are. In our setting, this means evaluating whether they can particularly help low-achieving individuals make better progress in their studies. So far we have found that the targeted default has strong effects on the important downstream outcomes for responsive students. Despite the fact that responsive students are a positively selected group in terms of e.g. past performance, this does not necessarily mean that it is the high achievers who benefit most from the targeted default. As we will show below, on many dimensions the treatment effects are, in fact, larger for those who rank lower in the performance distribution.
In Fig. 6 we show interactions of the treatment effect with pre-treatment performance, i.e. credits obtained in the previous semester (a measure of passed exams). For clarity of exposition, we estimate the parameters in three samples: the full sample of BuA students, the responsive sample, and the non-responsive sample among BuA students. More specifically, we estimate in these samples the following equation:

where
 is a discrete variable denoting the number of credit points (net of transferred credits) a student obtained in the first semester. All other variables and parameters are defined as before.
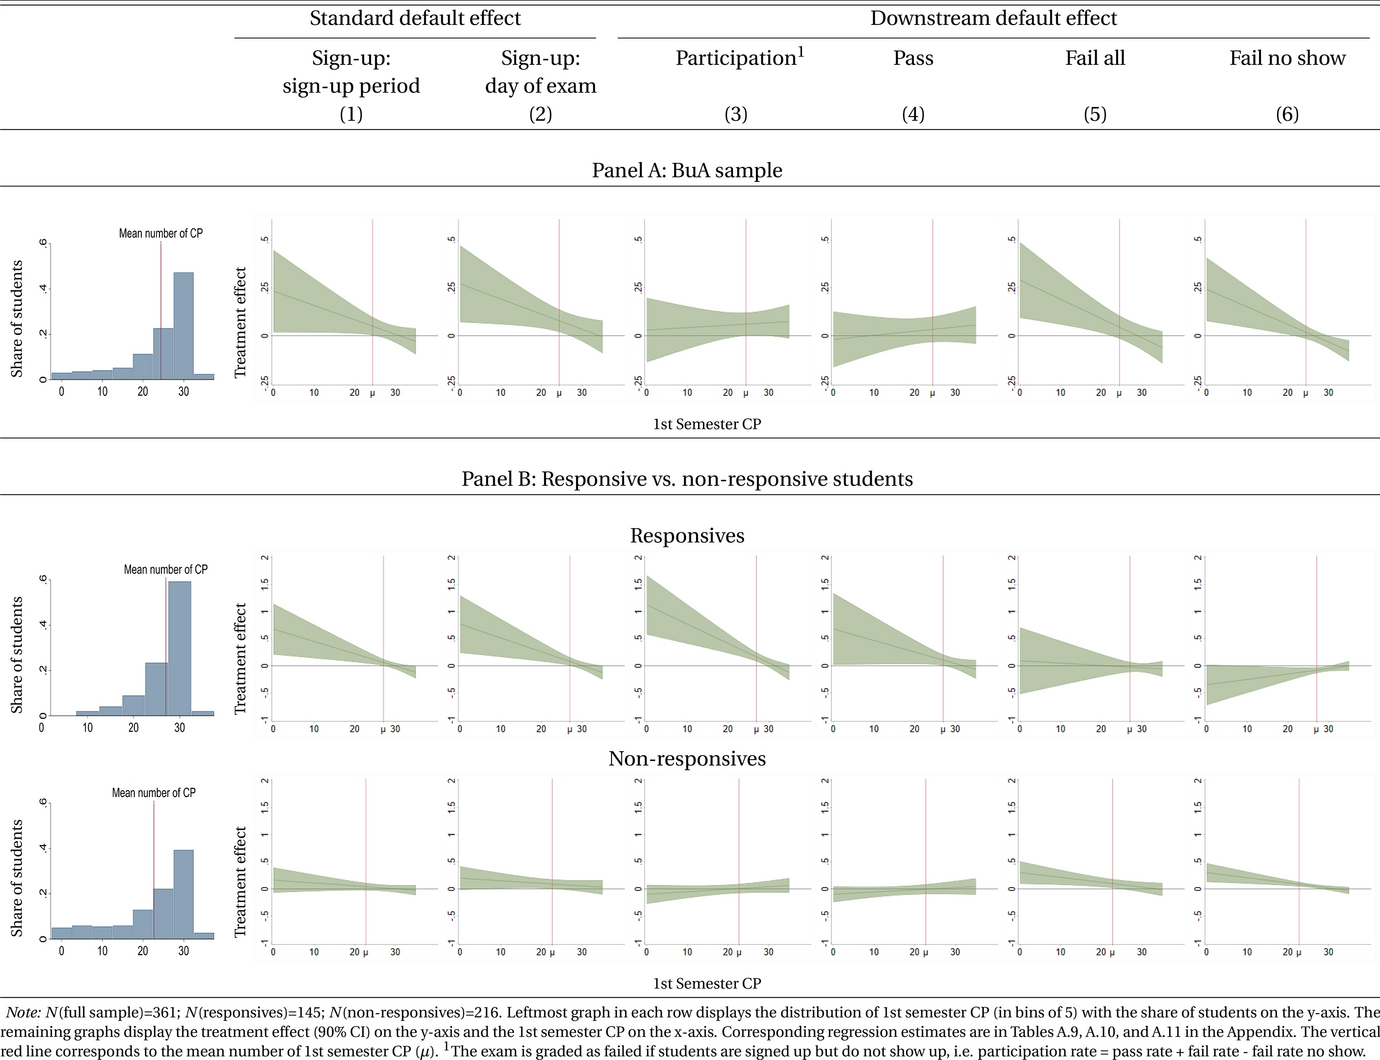
Fig. 6 Targeted default—Treatment effect, interaction with previous performance (CP). Note
N(full sample)
 361; N(responsives)
 145; N(non-responsives)
 216. Leftmost graph in each row displays the distribution of 1st semester CP (in bins of 5) with the share of students on the y-axis. The remaining graphs display the treatment effect (90% CI) on the y-axis and the 1st semester CP on the x-axis. Corresponding regression estimates are in Tables A.9, A.10, and A.11 in the Appendix. The vertical red line corresponds to the mean number of 1st semester CP (
 ).
).
 The exam is graded as failed if students are signed up but do not show up, i.e. participation rate = pass rate + fail rate − fail rate no show
Full BuA Sample For the full sample, the distribution of credits in the pre-treatment semester is shown in the top left corner of Panel A in Fig. 6 (corresponding regression estimates are shown in Tables A.17 and A.18 in the Appendix). Next to the distribution of credits, the treatment effects across the distribution of credits for the considered outcomes are visualized. Standard default effects are largest for the lower achieving students and taper out around 30 credits earned in the first semester (Columns 1 and 2). Further downstream, however, these large sign-up effects for the lowest 1st semester performers do not translate into above average participation or passing (Columns 3 and 4) but do lead to higher fail rates (Column 5). This is entirely driven by fails due to no-show (Column 6). However, we show below that a more nuanced picture arises once we differentiate between responsive and non-responsive students.
Responsive Students In the first row of graphs of Panel B in Fig. 6, we see an even more pronounced picture for the standard default effects: the effects on sign-up are much larger for the lower achieving students. For example, for students who obtained 20 credits in the first semester the treatment effect on initial (exam day) sign-ups is 21 pp (25 pp) (the corresponding regression estimates are in Table A.18 in the Appendix). The effects fade out again around 30 credits. It is important to note that there is not much support in the lowest part of the performance distribution, so e.g. the large main effect of treatment on a person with zero credits in the pre-treatment semester should be interpreted with caution. The main difference to the overall sample is that the increased sign-ups for the weaker students do not result in higher fail rates. Quite the contrary, they go with higher participation and passing, and a drop in fails due to no-shows: for a student with 20 credits in the first semester, the probability of participating increases by 40 pp, the probability of passing by 26 pp.
Non-responsive students The results we have shown so far imply that the effect on the overall fail rate we saw in the full sample is driven by the non-responsive students. The last row of graphs of Panel B in Fig. 6 shows that the standard default effect seems to be somewhat stronger for the lower achieving non-responsive students in comparison to high achievers, and that the rise in sign-ups leads to increased fails, all of which is due to no-shows—supporting the idea that this is a group of students whose interests are not aligned with the default setter and who therefore cannot be moved to exert more post-intervention effort. Sticking with the default in this case does not lead to beneficial outcomes.
Overall, this analysis shows that the targeted default particularly increases the sign-ups for lower achieving students, but that downstream the consequences of this standard default effect are vastly different. Weaker non-responsive students become no-show fails at high rates, whereas weaker responsive students can convert the higher sign-ups into participation and, ultimately, passing of the exam. While being responsive correlates with higher pre-treatment achievement, the important message is that the lower achieving individuals among the responsive students are the ones who benefit most from changing the default. Due to the nature of our outcome—which requires post-intervention effort—for the non-responsive students the standard default effects do not result in better academic performance.
3.6 Drivers of the downstream effects
The “Student Satisfaction Monitor” not only enables us to identify the responsive students, but for this edition of the survey we asked three questions about the statistics course.Footnote 38 These questions can shed some light on the mechanisms that drive the effects among the responsive students. In particular, we inquired whether the respondents attended the statistics class and/or the accompanying tutorial—and if so, how often. We also asked how many hours per week the respondents spent preparing for the statistics class, on top of lectures and tutorials.Footnote 39 The effects of the opt-out treatment on the above variables are shown in Table 10. The data show that automatic sign-up for the statistics exam increases effort, as it raises attendance in the statistics course/tutorial by around 11 pp (Columns 1 and 2). Conditional on attending at all, the frequency of attendance may be somewhat higher but the estimates are not statistically significant. Finally, we see that treated students spend more hours per week preparing for the statistics class on top of lectures and tutorials, again indicating increased effort.
Table A.19 in the Appendix displays the remaining survey outcomes. We observe in Columns 1 and 2 that the automatic sign-up increases lecture attendance overall. An estimation controlling for frequency of statistics attendance reduces the effects in Columns (1) and (2) to
 (SE: 0.060) and
 (SE: 0.059); not shown in the Table. This very tentatively suggests that the positive effect on the overall attendance may be mainly due to the increase in attendance in the statistics lecture—though of course these results come with the caveat that we are controlling for an outcome (“bad control”, see Angrist & Pischke Reference Angrist and Pischke2008). In addition, we find the treatment has no effects on study time on top of lectures, satisfaction with the study program, life satisfaction and stress (Table A.19 in the Appendix).
Overall this suggests a rather straightforward mechanism where the automatic sign-up leads responsive students to subsequently increase lecture attendance and study time, in order to be able to pass the exam. This finding is very relevant not only from an education policy perspective, but for the default literature in general, because it shows that for a substantial share of individuals, default settings can lead to active behavior changes and elicit sizable investments of effort and time.
4 Conclusion
Many tasks are characterized by a need to invest substantial amounts of time and effort in order to complete them. In this paper we have investigated whether default interventions can be effective policy tools to increase the take-up of such tasks and, importantly, subsequent (successful) task completion rates. We have shown in a higher education setting that: (i) task take-up (i.e. exam sign-up) increases when an opt-out rule applies—perhaps unsurprisingly so, as simply staying signed up for the demanding task does not require effort, and is therefore conceptually similar to standard default effects reported in the literature; (ii) when the opt-out applies to a specific task (one predetermined exam) rather than many tasks (all exams), downstream effects on exam participation, i.e. task completion, can be observed; (iii) among the large group of previously responsive individuals, the opt-out rule increases successful task completion (passing the exam), supporting recent research which shows that the alignment of interests between default-setter and defaultee is an important driver of default effects (Tannenbaum et al., Reference Tannenbaum, Fox and Rogers2017; Altmann et al., Reference Altmann, Falk and Grunewald2022; iv) the effect on successful task completion is driven by increased investment of time and effort in the months leading up to task completion (attending class and studying).
We believe it is essential to replicate experimental results (see, e.g., Czibor et al., Reference Czibor, Jimenez-Gomez and List2019), and therefore we see our study as a starting point for further research into default effects in settings where post-default effort is required. Second, our results open up new potential fields where opt-out rules can be (experimentally) tested. We have shown that in higher education, they can be an interesting addition to more traditional measures aimed at improving the outcomes of weaker students. Other examples for substantially effortful tasks where take-up is typically optional and where policy seeks to increase participation and completion include training programs for employees and the unemployed, volunteer work or extracurricular activities in school.
Heterogeneous responses should be expected. Successful use in policy then requires focusing on individuals whose interests are likely to be aligned with those of the policymaker, e.g., by identifying individuals who have displayed responsiveness in the past (see also Heffetz et al., Reference Heffetz, O’Donoghue and Schneider2022). As we have seen, others may well leave the default setting in place, but ultimately this may not be in their best interest.
Funding
Open Access funding enabled and organized by Projekt DEAL.


 =
= =
= =
= μ
μ 1
1


 Open access